ETH will 5X from HERE! Hit the Like to manifest this.I'm serious hit the like to turn this #HVF into a reality.
I have been monitoring this pattern build out for years now.
BUT we are on the verge on triggering this pattern any day now, and triggering a massive Altcoin run which sucks in capital from all parts of the globe.
@TheCryptoSniper
ETHUSD trade ideas

ETHEREUM is repeating BITCOIN's 2018-2021 Cycle!Ethereum (ETHUSD) has found itself on a very strong rally since the April 07 bottom, which resembles the V-shaped recovery of Bitcoin on the March 09 2020 bottom. In fact BTC's whole 2018 - 2021 Bull Cycle resembles ETH's 2022 - 2025 Cycle so far.
So far ETH is struggling to break above its 1W MA50 (blue trend-line) but the most important Resistance of the Cycle is the ATH Lower Highs trend-line. When that broke for Bitcoin, a parabolic rally started. Do you think we will see such a break-out on ETH too by the end of the year?
-------------------------------------------------------------------------------
** Please LIKE 👍, FOLLOW ✅, SHARE 🙌 and COMMENT ✍ if you enjoy this idea! Also share your ideas and charts in the comments section below! This is best way to keep it relevant, support us, keep the content here free and allow the idea to reach as many people as possible. **
-------------------------------------------------------------------------------
💸💸💸💸💸💸
👇 👇 👇 👇 👇 👇

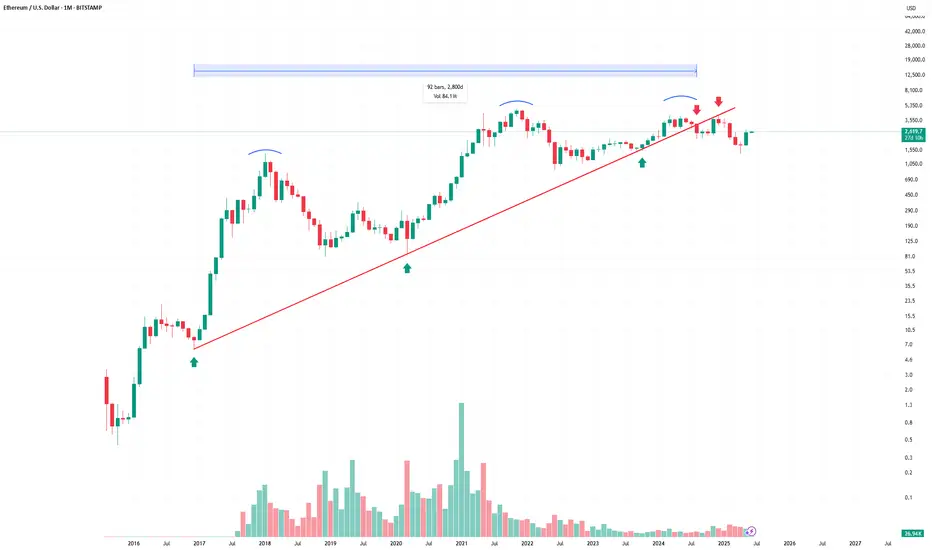
This is why I don't buy Ethereum.This chart shows a clear loss of momentum after a long-term uptrend.
The trendline supported the price for years, confirmed multiple times (green arrows).
Price broke below the trendline and failed to reclaim it (red arrows = rejection).
We're seeing a potential triple top pattern with lower highs (blue curves), a classic distribution signal.
📉 Last candle confirms breakdown structure — lower highs, and now lower lows.
I'm not saying ETH is dead.
But for me, this is not a buy.
Until it reclaims the trendline or shows true strength with a breakout and volume, I'm staying out.
Thanks For Reading.
ETH/USD.1D CHART PATTERN.I'm looking at a long trade idea on ETH/USD with the following structure:
Buy Entry: $2,740
Target 1: $3,320
Target 2: $4,000
Here's a breakdown of the trade setup and key considerations:
---
📈 Trade Summary
Parameter Value
Entry $2,740
Target 1 $3,320
Target 2 $4,000
Potential Upside (to T1) ~21.2%
Potential Upside (to T2) ~46%
---
🔍 Technical Considerations
Before entering, consider:
1. Support at $2,740:
Check if this level aligns with major moving averages (e.g., 100/200-day) or prior demand zones.
2. Resistance Zones:
Around $3,320: Watch for profit-taking pressure or horizontal resistance.
$4,000: Likely a strong psychological and technical barrier.
3. Volume Confirmation:
Look for rising volume or breakout candles to confirm momentum.
---
⚠ Risk Management
Stop Loss: Consider placing it below recent support (e.g., ~$2,600 or tighter, depending on strategy).
Position Sizing: Use a % of your portfolio that fits your risk tolerance (e.g., risking 1–2% per trade).
---
✅ Example Risk/Reward (R:R)
To Target 1:
Risking $140 (Stop at $2,600), Gain of $580 → R:R ~4.1:1
To Target 2:
Gain of $1,260 → R:R ~9:1
---
Would you like a chart with technical indicators or help automating alerts on TradingView?

ETHUSD Break- Test- GO!!! Nothing Changed!I have to repost this bc TV only gives me limited updates before it forces "target reached." Here is my previous post.
Nothing has changed. Just as I expected. If anything, it looks even more bearish now. As always, wait for the hook!
Click Boost, and follow Let's get top 5,000!

ETH updateDo you understand breakout n retest? Well this is how market brakes out this is how to see if a trend breakout,I don't not have any reason to sell this pair because it's already shift and breakout from temporary selling trend soo the best n easy way to follow it now is to do what, to counter pull back n manage to move with the trend,I do not believing in explanations or telling peoples many thing,simple analysis few explanations right directions we win n let looser make noise,do not believe in explanations more than what you see.

ETHUSD next move ETHUSD – 4H Chart Analysis
Structure: Downward Parallel Channel
Market Behavior: Price is respecting both support and resistance levels within the channel
Current Position: Price is testing the upper boundary / resistance zone
📉 Sell Bias – Potential rejection from resistance zone
Entry: 2559
Stop Loss: 2614
Target: 2379

ETHUSD Is Going Down! Sell!
Here is our detailed technical review for ETHUSD.
Time Frame: 1D
Current Trend: Bearish
Sentiment: Overbought (based on 7-period RSI)
Forecast: Bearish
The market is trading around a solid horizontal structure 2,485.23.
The above observations make me that the market will inevitably achieve 2,013.51 level.
P.S
We determine oversold/overbought condition with RSI indicator.
When it drops below 30 - the market is considered to be oversold.
When it bounces above 70 - the market is considered to be overbought.
Disclosure: I am part of Trade Nation's Influencer program and receive a monthly fee for using their TradingView charts in my analysis.
Like and subscribe and comment my ideas if you enjoy them!

ETH: Ethereum’s Next Big Move! Stablecoin SuperCycle Part 2Ethereum has been moving in 3 wave corrective structures this entire bull market, possibly in an ending diagonal structure. Wave 4 (Green) most likely unfolded as a WXY Double Zig bottoming at the 1.618-1.786 trend based fib extension. Focusing on Wave 5 (Green), a common target of Wave 5 (Green) is the 1.618 to 1.786 fibbonaci retracement between $8,007 and $9,607.


ETHUSD – 4H Chart AnalysisPrice has reached a key resistance zone around the 2,700 level. The market structure suggests potential for a downward move from this area, forming lower highs and indicating selling pressure.
📉 Sell Idea
Entry: 2,605
Target 1: 2,506
Target 2: 2,398
Target 3: 2,303
Stop Loss: Above 2,725
Structure-based trade setup with risk-to-reward in favor of sellers. Will be watching for confirmation through bearish price action on lower timeframes.
⚠️ This is not financial advice. For educational and analysis purposes only.

ETHUSD: The Market Is Looking Down! Short!
My dear friends,
Today we will analyse ETHUSD together☺️
The price is near a wide key level
and the pair is approaching a significant decision level of 2,512.0 Therefore, a strong bearish reaction here could determine the next move down.We will watch for a confirmation candle, and then target the next key level of 2,501.7..Recommend Stop-loss is beyond the current level.
❤️Sending you lots of Love and Hugs❤️

ETH Bulls Back in Play Above $2800ETH/USD has pushed above $2800, a key level it has done significant work either side of going back to 2022. Having broken above the important 200-day moving average earlier this week, and with indicators like RSI (14) and MACD pointing to growing topside momentum, a close above $2800 may encourage other bulls to join in the run higher.
If the price can hold $2800, longs could be established above the level with a stop below for protection. The price action around $2800 during February reinforces the need to see the breakout stick before entering the trade.
$3000 screens as a potential target, as does $3525—the 78.6% retracement of the December–April bear move. Beyond, $3750 was tagged on multiple occasions late last year, making it another possibility before the record highs come into view.
If the price is unable to stick the $2800 break, the setup would be invalidated.
Good luck!
DS

Weekly RSI Breakout Could Signal Ethereum's Bullish ContinuationEthereum (ETH) is approaching a major technical inflection point on the weekly chart. The price continues to respect a long-term ascending channel that has defined its macro trend since early market cycles. ETH is now testing the upper boundary of this channel, coinciding with macro resistance around the $3,000 area.
Meanwhile, the weekly RSI is also nearing a crucial descending trendline that has historically marked momentum exhaustion. A breakout above this RSI resistance would indicate a shift in underlying market strength, and could trigger bullish continuation toward $3,500–$4,000.
However, failure to break this RSI resistance — especially combined with the current bearish divergence between price and RSI — may signal an upcoming correction or a phase of consolidation before any major breakout occurs.
🔍 Key Technical Highlights:
Price nearing upper channel resistance
Bearish divergence present on the RSI
Weekly RSI testing descending trendline
Volume profile shows thin liquidity above current levels
Conclusion:
ETH is at a decision point. A confirmed RSI breakout could validate further upside, while rejection from this level may lead to a short- to mid-term pullback. Monitor RSI closely on the weekly chart — it may dictate Ethereum's next major move.

Cup w/ HandleFour week handle forming. Looks ready to go for a breakout for the ATHs shortly. RSI reset


Bullish continuation?Ethereum (ETH/USD) is falling towards the pivot and could bounce to the 1st resistance.
Pivot: 2,364.01
1st Support: 2,548.35
1st Resistance: 2,788.17
Risk Warning:
Trading Forex and CFDs carries a high level of risk to your capital and you should only trade with money you can afford to lose. Trading Forex and CFDs may not be suitable for all investors, so please ensure that you fully understand the risks involved and seek independent advice if necessary.
Disclaimer:
The above opinions given constitute general market commentary, and do not constitute the opinion or advice of IC Markets or any form of personal or investment advice.
Any opinions, news, research, analyses, prices, other information, or links to third-party sites contained on this website are provided on an "as-is" basis, are intended only to be informative, is not an advice nor a recommendation, nor research, or a record of our trading prices, or an offer of, or solicitation for a transaction in any financial instrument and thus should not be treated as such. The information provided does not involve any specific investment objectives, financial situation and needs of any specific person who may receive it. Please be aware, that past performance is not a reliable indicator of future performance and/or results. Past Performance or Forward-looking scenarios based upon the reasonable beliefs of the third-party provider are not a guarantee of future performance. Actual results may differ materially from those anticipated in forward-looking or past performance statements. IC Markets makes no representation or warranty and assumes no liability as to the accuracy or completeness of the information provided, nor any loss arising from any investment based on a recommendation, forecast or any information supplied by any third-party.

$ETH prepares for a bullish wave!Ethereum's breakout and retest of the $2.5k level of major resistance on a monthly basis has been completed and ethereum, which also reclaimed its ma50 moving average, is ready for a bullish wave !


Etherium is following the trendas we all noticed that the crypto was retracing its significant keys, going to redefine the new era of crypto currency , etherium stays solid in this erea showing no mitigation. we assume that its bullish following other big crypto like etherium, sol, btc

ETH/USD Long Setup – Bullish Reversal in Play📅 Date: June 7, 2025
⏱ Timeframe: 30-Minute (COINBASE)
📊 Pair: Ethereum / U.S. Dollar (ETH/USD)
💡 Trade Idea Summary:
Ethereum is showing signs of a bullish reversal after a strong corrective move. Price has formed a potential higher low structure and is preparing for a bullish continuation.
🔹 Entry: $2,454
🎯 Target: $2,600
🛡️ Stop Loss: $2,376
⚖️ Risk-Reward Ratio: ~1.9:1
📈 Technical View:
Recent downtrend appears exhausted with a clear bounce from the $2,384 zone.
Break of lower highs indicates shift in momentum.
Expecting a short-term dip to retest the higher low before continuation towards $2,600.
Ideal for swing traders or short-term bullish setups.
📌 Trade Management Tips:
Watch for bullish confirmation near $2,454 before full entry.
Trail stop if price breaks above $2,520 for risk reduction.
Avoid the trade if price closes below $2,376 on the 30m chart.
🔔 Disclaimer: Not financial advice. Always do your own research and manage risk appropriately.

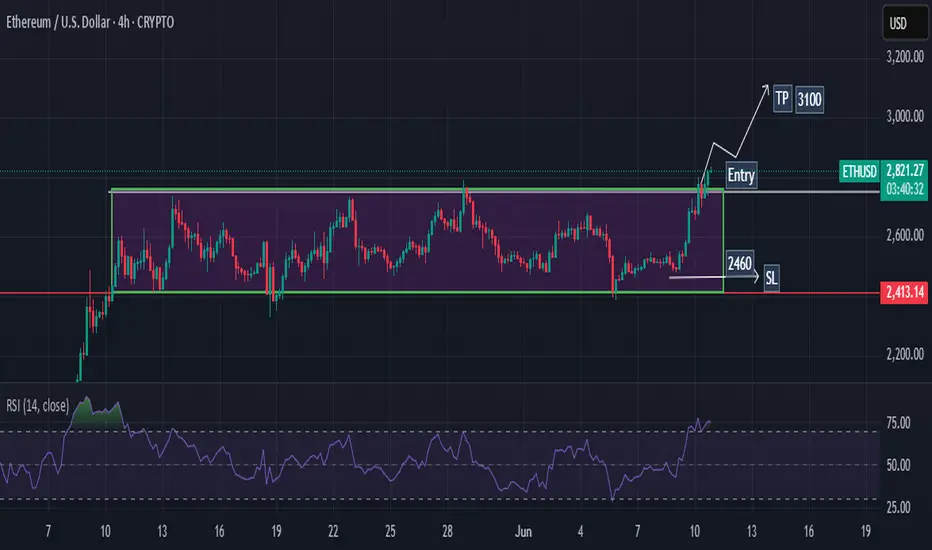
ETH HIT THE LIKE TO MANIFEST THISETH/USD is teasing the breakout zone again... 👀
Are we finally ready for liftoff, or is it another fakeout? 🚀🔄
The chart’s looking spicy, and the energy feels right. 🌌
Hit that like to manifest the pump — we’re in this together. 💎🙏
Let’s speak green candles into existence! 📈✨
#ETH #Ethereum #CryptoVibes #ManifestMoneyMoves #ETHUSD #ToTheMoon"
