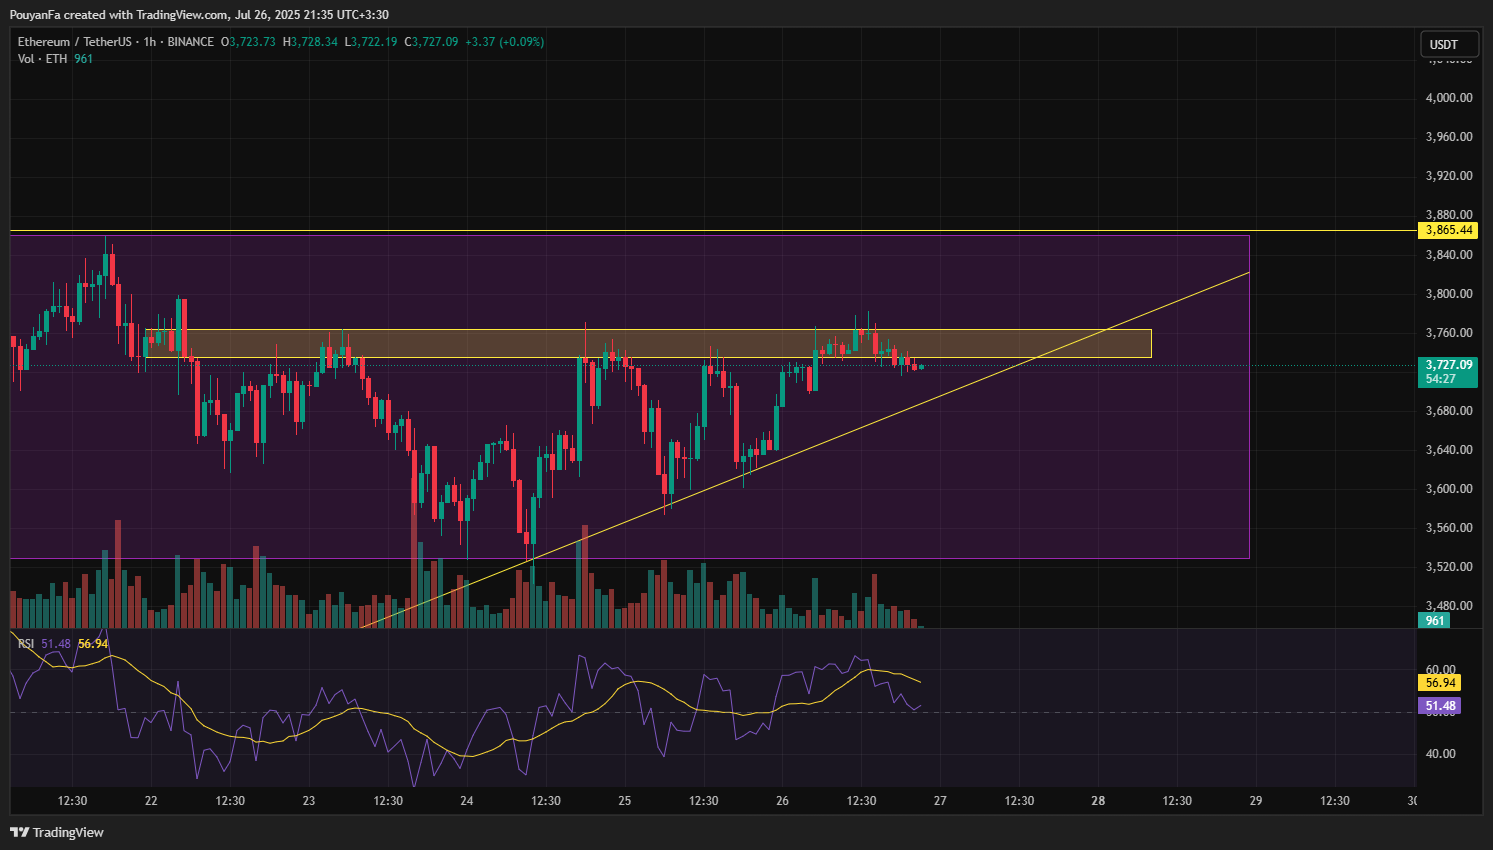
Ethereum / TetherUS

No trades
See on Supercharts

Ethereum / TetherUS forum


BTCUSDT.P ETHUSDT.P SOLUSDT.P ADAUSDT.P XRPUSDT.P

Updated BTC Analysis – March 3, 2025

1️⃣ Key Developments:

✅ Previous Analysis Worked Perfectly
- The price dropped as expected, filling the previous CME gap at around 77.5K and reacting strongly from the Fair Value Gap (FVG) and Order Block (OB) around 80,722 - 85,645.
- The bounce aligned with the 200 EMA, confirming it as a strong support level.
- The recovery has now led to the formation of a new CME gap between 91,600 - 85,720 over the weekend.

2️⃣ New CME Gap (91,600 - 85,720) & Current Structure
Gap Behavior:
- This new gap represents an area of inefficiency that the market may attempt to fill in the coming days.
- Historically, Bitcoin fills CME gaps with high probability, so we should expect price action to revisit this zone.
- Price Reaction:
The price spiked up towards 91,600 but faced resistance.
- It has not yet completed the full gap-fill process, meaning another potential move down to 85,720 could happen before a stronger push up.

3️⃣ Confirmation from Indicators:
- RSI: Recovering but still below the 50 level, meaning momentum is neutral-to-bearish.
- MACD: Bullish crossover is forming, showing signs of momentum shift, but it is not fully confirmed yet.

📊Volume Profile:
- High volume node at 97,800 suggests strong resistance above.
- Low liquidity area around 85,720 increases the chances of a wick down to fill the CME gap.

4️⃣ Key Scenarios Moving Forward:
- Bullish Case: If price breaks and holds above 91,600, it could target:
93,261 (previous resistance)
97,800 - $100,000 (next major liquidity zone)

- Bearish Case: (Gap Fill to the Downside)
If price rejects 91,600 and loses 85,720, it could retest:
82,500 - $80,722 (previous FVG and OB)
78,000 region as deeper liquidity grab

5️⃣ Conclusion:
- The previous analysis has worked flawlessly, and it continues to hold well. The new CME gap between 91,600 - 85,720 now becomes the primary area to watch.

- If the market fills it from above, expect support at 85,720.
- If it fills from below, a breakout above 91,600 could trigger bullish continuation.

- Watch how price reacts at 91,600 resistance and 85,720 support.
- A daily close above 91,600 strengthens the bullish case.
- A rejection and drop below 85,720 means lower prices before the next leg up.
Snapshot

BTCUSDT Binance announced that it will delist all non-MiCA compliant stablecoin trading pairs in the European Economic Area starting March 31, including USDT, FDUSD, TUSD, USDP, DAI, AEUR, UST, USTC, and PAXG. Binance recommends that users convert these assets to MiCA compliant stablecoins such as USDC, EURI, or the euro (EUR).

BTCUSD ETHUSDT BNBUSDT DOGEUSDT


ETHUSDT Eth already in danger of giving up all of yesterdays gains.....the daily chart is outrageous... in a downtrend for months now


ETHUSDT.P ETHUSD BTCUSD BTCUSDT I wish I wasn’t comment timed out last night when that dude posted about those MASSIVE liquidations within like $30 striking distance of where we were on ETH, if you see that shit assume that person knows more than we do and get out of your shorts. I kept my BTC one on because it was a scalp for like a 800 dollar move and I had a stop loss but when you see someone make moves with THAT kinda confidence? scared money dont make no money and that dude got PAID
EDIT: More than likely insider trading like that dude posted below

PEPEUSDT PEPEUSD ETHUSDT Donald Trump is calling on X (exTwitter) that biggest altseason is coming and people will call it "Trump season" 🤪😁