$COST is transiting from the Markup to the Accumulation (A)The squeezing and oversold momentum readings suggest the markdown is losing steam and "stopping action" may be occurring. We could be witnessing the area where a Selling Climax or preliminary support forms. I'm not looking for a new all-time high, but a trip to test resistance seems likely.
Key facts today
Next report date
—
Report period
—
EPS estimate
—
Revenue estimate
—
15.6 EUR
6.67 B EUR
230.35 B EUR
442.65 M
About Costco Wholesale
Sector
Industry
CEO
Roland M. Vachris
Website
Headquarters
Issaquah
Founded
1983
FIGI
BBG00KG3Y904
Costco Wholesale Corp. engages in the provision of operation of membership warehouses through wholly owned subsidiaries. It operates through the following geographical segments: United States, Canada, and Other International Operations. The company was founded by James D. Sinegal and Jeffrey H. Brotman in 1983 and is headquartered in Issaquah, WA.
Related stocks
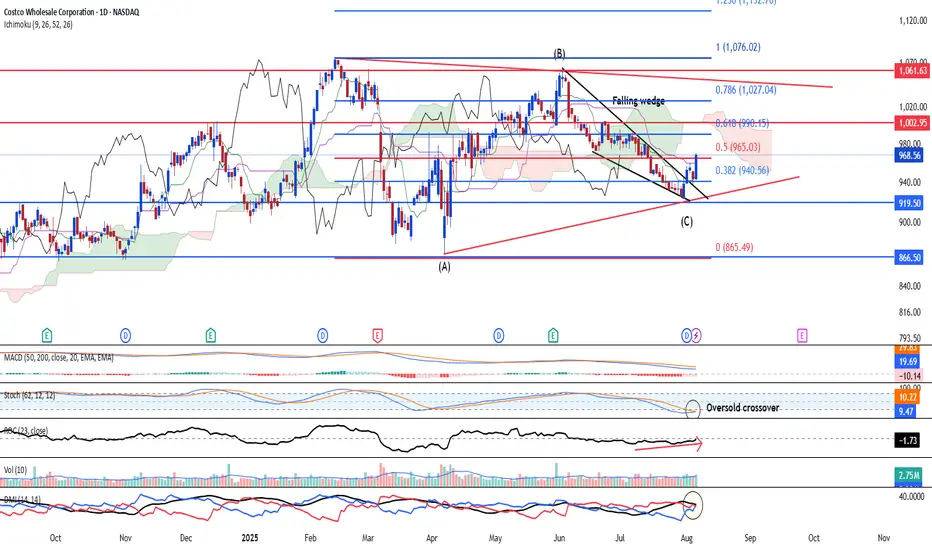
COSTCO looking to end its ABC corrective waveNASDAQ:COST saw a potential end to its ABC corrective structure after it has formed a potential symmetrical triangle/larger pennant. Strong bullish marobozu was seen closing above the conversion and base line of the ichimoku. The breaking out of the falling wedge also highlights more potential upsi
COSTCO Looking for a bottom to fuel rally to $1250.Last time we looked at Costco (COST) was 6 months ago (January 21) when we gave the most optimal buy signal exactly at the bottom of the Channel Up at the time, easily hitting our $1045 Target:
Since then, the stock has entered a new Accumulation Phase in the form of a Triangle and this week br

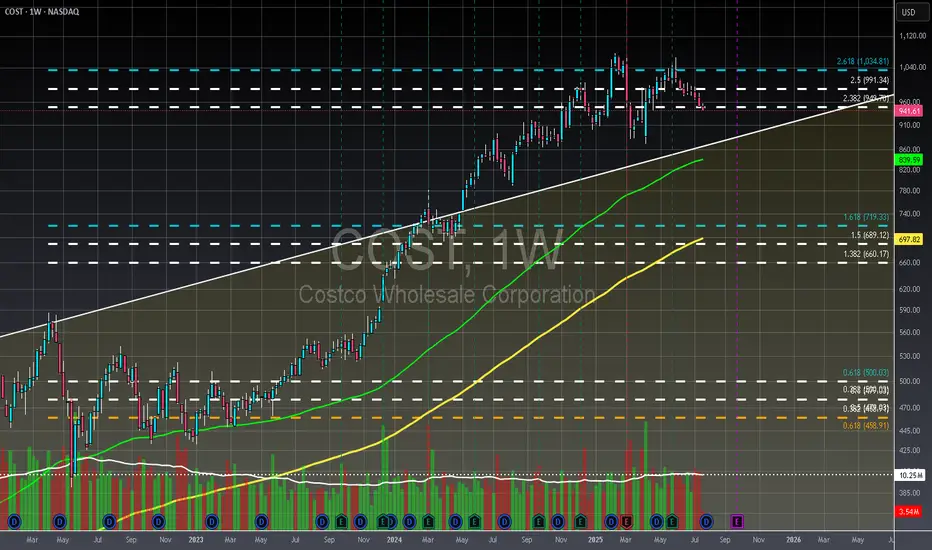
COST - Weekly - OverboughtCostco is currently trading outside a monthly channel it has been in since 1992, which could signal strong demand or overzealous traders. If Costco fails to break the $1034 Fibonacci level, considered the golden target for bulls, a reversal is likely, potentially leading to a return to the 100-perio
Costco has broken down from a rising trend Costco has broken down from a rising trend with increased volume and a significant price drop exceeding 3%.
The trendline has not been retested after the breakdown, but a retest is not required.
The price has support around 910 and 875.
There is a declining RSI(21) and negative volume balance over t

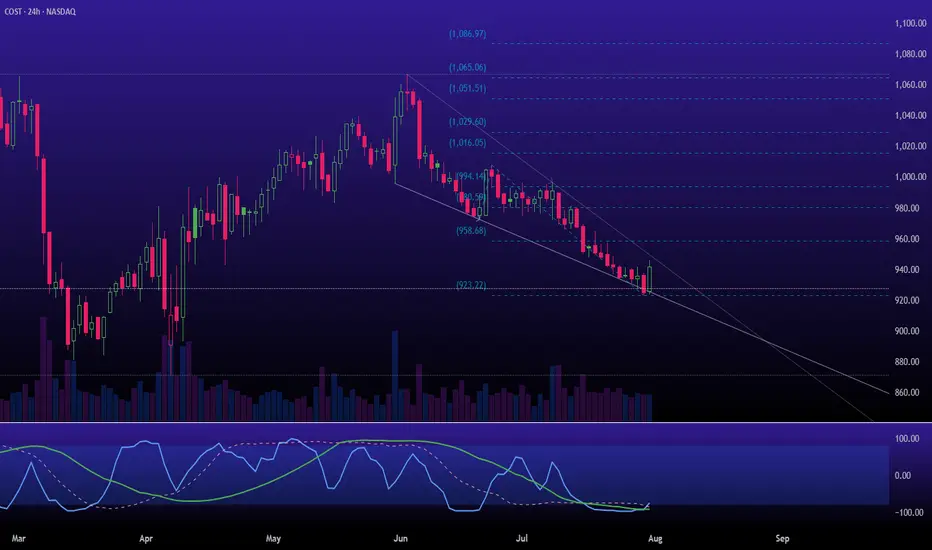
Costco Wave Analysis – 16 July 2025
- Costco broke the support area
- Likely to fall to support level 940.00
Costco recently broke the support area located between the pivotal support level 970.00 and the 50% Fibonacci correction of the upward impulse from April.
The breakout of this support area accelerated the C-wave of the activ

Potential Top in CostcoCostco Wholesale has been quietly limping, and some traders may see downside risk in the big-box retailer.
The first pattern on today’s chart is the June low of $973.90. COST made lower highs while trying to hold that level but is now sliding below it. That may be viewed as a potentially bearish tr

Costco is in the Wyckoff distribution phaseThis Week (July 8 - 11):
Support: The immediate floor is at $965. Below that, the low from the initial sell-off around $955 is critical.
Resistance: The 20-day moving average (that green line) at ~$992 is the first ceiling. If it gets frisky, look for sellers to appear at $1,030.
Next Month (July

Costco: Strong Membership Model Suggests Bullish Upside Current Price: $987.02
Direction: LONG
Targets:
- T1 = $1,016.00
- T2 = $1,032.00
Stop Levels:
- S1 = $957.00
- S2 = $940.00
**Wisdom of Professional Traders:**
This analysis synthesizes insights from thousands of professional traders and market experts, leveraging collective i

COST Daily Chart Analysis: Key Levels, and Price StructureCostco Wholesale Corporation (COST)
Historical Context and Trend Channel:
From September 2024 through early 2025, COST was observed trading within a well-defined upward channel (indicated by the grey shaded areas). This channel represented a consistent bullish trend during that period. Howeve

See all ideas
Summarizing what the indicators are suggesting.
Neutral
SellBuy
Strong sellStrong buy
Strong sellSellNeutralBuyStrong buy
Neutral
SellBuy
Strong sellStrong buy
Strong sellSellNeutralBuyStrong buy
Neutral
SellBuy
Strong sellStrong buy
Strong sellSellNeutralBuyStrong buy
An aggregate view of professional's ratings.
Neutral
SellBuy
Strong sellStrong buy
Strong sellSellNeutralBuyStrong buy
Neutral
SellBuy
Strong sellStrong buy
Strong sellSellNeutralBuyStrong buy
Neutral
SellBuy
Strong sellStrong buy
Strong sellSellNeutralBuyStrong buy
Displays a symbol's price movements over previous years to identify recurring trends.
COST4977644
Costco Wholesale Corporation 1.75% 20-APR-2032Yield to maturity
4.62%
Maturity date
Apr 20, 2032
COST4977643
Costco Wholesale Corporation 1.6% 20-APR-2030Yield to maturity
4.30%
Maturity date
Apr 20, 2030
COST4977642
Costco Wholesale Corporation 1.375% 20-JUN-2027Yield to maturity
3.92%
Maturity date
Jun 20, 2027
COST4495548
Costco Wholesale Corporation 3.0% 18-MAY-2027Yield to maturity
3.88%
Maturity date
May 18, 2027
See all 4COST bonds
Curated watchlists where 4COST is featured.

Frequently Asked Questions
The current price of 4COST is 842.1 EUR — it has increased by 0.57% in the past 24 hours. Watch COSTCO WHOLESALE stock price performance more closely on the chart.
Depending on the exchange, the stock ticker may vary. For instance, on EUROTLX exchange COSTCO WHOLESALE stocks are traded under the ticker 4COST.
4COST stock has risen by 2.15% compared to the previous week, the month change is a 0.81% rise, over the last year COSTCO WHOLESALE has showed a 9.46% increase.
We've gathered analysts' opinions on COSTCO WHOLESALE future price: according to them, 4COST price has a max estimate of 1,050.87 EUR and a min estimate of 763.49 EUR. Watch 4COST chart and read a more detailed COSTCO WHOLESALE stock forecast: see what analysts think of COSTCO WHOLESALE and suggest that you do with its stocks.
4COST reached its all-time high on Feb 18, 2025 with the price of 1,040.6 EUR, and its all-time low was 147.0 EUR and was reached on Mar 26, 2018. View more price dynamics on 4COST chart.
See other stocks reaching their highest and lowest prices.
See other stocks reaching their highest and lowest prices.
4COST stock is 0.57% volatile and has beta coefficient of 0.53. Track COSTCO WHOLESALE stock price on the chart and check out the list of the most volatile stocks — is COSTCO WHOLESALE there?
Today COSTCO WHOLESALE has the market capitalization of 371.63 B, it has decreased by −1.36% over the last week.
Yes, you can track COSTCO WHOLESALE financials in yearly and quarterly reports right on TradingView.
COSTCO WHOLESALE is going to release the next earnings report on Sep 25, 2025. Keep track of upcoming events with our Earnings Calendar.
4COST earnings for the last quarter are 3.77 EUR per share, whereas the estimation was 3.73 EUR resulting in a 1.01% surprise. The estimated earnings for the next quarter are 4.98 EUR per share. See more details about COSTCO WHOLESALE earnings.
COSTCO WHOLESALE revenue for the last quarter amounts to 55.71 B EUR, despite the estimated figure of 55.65 B EUR. In the next quarter, revenue is expected to reach 73.67 B EUR.
4COST net income for the last quarter is 1.68 B EUR, while the quarter before that showed 1.72 B EUR of net income which accounts for −2.68% change. Track more COSTCO WHOLESALE financial stats to get the full picture.
Yes, 4COST dividends are paid quarterly. The last dividend per share was 1.12 EUR. As of today, Dividend Yield (TTM)% is 0.49%. Tracking COSTCO WHOLESALE dividends might help you take more informed decisions.
COSTCO WHOLESALE dividend yield was 0.49% in 2024, and payout ratio reached 26.32%. The year before the numbers were 0.71% and 27.12% correspondingly. See high-dividend stocks and find more opportunities for your portfolio.
As of Aug 9, 2025, the company has 333 K employees. See our rating of the largest employees — is COSTCO WHOLESALE on this list?
EBITDA measures a company's operating performance, its growth signifies an improvement in the efficiency of a company. COSTCO WHOLESALE EBITDA is 10.97 B EUR, and current EBITDA margin is 4.53%. See more stats in COSTCO WHOLESALE financial statements.
Like other stocks, 4COST shares are traded on stock exchanges, e.g. Nasdaq, Nyse, Euronext, and the easiest way to buy them is through an online stock broker. To do this, you need to open an account and follow a broker's procedures, then start trading. You can trade COSTCO WHOLESALE stock right from TradingView charts — choose your broker and connect to your account.
Investing in stocks requires a comprehensive research: you should carefully study all the available data, e.g. company's financials, related news, and its technical analysis. So COSTCO WHOLESALE technincal analysis shows the buy rating today, and its 1 week rating is neutral. Since market conditions are prone to changes, it's worth looking a bit further into the future — according to the 1 month rating COSTCO WHOLESALE stock shows the buy signal. See more of COSTCO WHOLESALE technicals for a more comprehensive analysis.
If you're still not sure, try looking for inspiration in our curated watchlists.
If you're still not sure, try looking for inspiration in our curated watchlists.