FHE/USDT Analysis – High Probability of a Bullish Trend
This futures pair is showing strong signs of entering a full-fledged bullish trend.
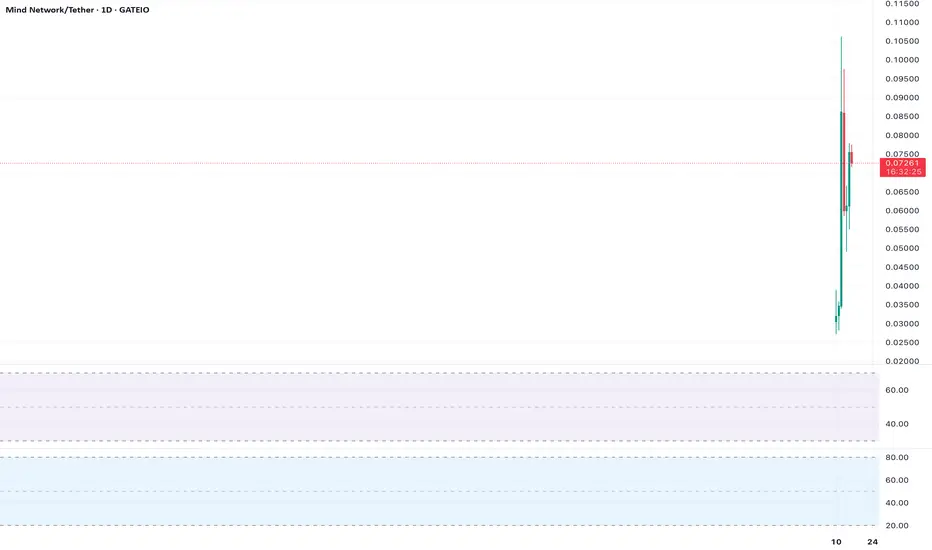
We are currently attempting to break through the key level of $0.078.
Below that, a strong volume zone has formed at $0.0756–$0.072, which is now acting as support.
We're looking at a potential long position up

FHE PERPETUAL TRADE Sold at $0.088FHE PERPETUAL TRADE
FHEUSDT SELL SETUP
Currently $0.087
Sold at $0.088
(Trading plan If FHE/USDT up to $0.10 we will add more shorts)
Expecting target $0.08 OR DOWN
Incase of early exist will update this anaylsis
Its not a Financial advice

Fibonacci Retracement Points to $0.0000010 TargetAnalysis:
ASX:FHE ’s 1-day chart shows the price at $0.00000079, near the 61.8% Fibonacci retracement level from a prior swing high ($0.0000015) to low ($0.00000050). A bounce from this level could target the 38.2% retracement at $0.0000010. RSI is neutral at 42.
Actionable Insight:
Long at $0.0000

Ichimoku Cloud Resistance Looms at $0.00000090Analysis:
On the 4-hour chart, ASX:FHE is approaching the Ichimoku Cloud’s lower edge at $0.00000090. The price is at $0.00000079, with the Tenkan-sen crossing above the Kijun-sen, signaling short-term bullishness. A cloud breakout could target $0.0000012, but low liquidity adds risk.
Actionable I

Double Bottom at $0.00000075 Signals ReversalAnalysis:
ASX:FHE ’s daily chart shows a potential double bottom at $0.00000075, a bullish pattern. The price is at $0.00000079, with RSI rising from oversold levels (30). A move above $0.00000085 confirms the pattern, targeting $0.0000011. Low volume is a risk.
Actionable Insight:
Long on a break
Volume Spike Could Ignite BreakoutAnalysis:
ASX:FHE ’s 1-hour chart shows a minor volume spike at $0.00000079, hinting at accumulation. The price is near the 50-period SMA ($0.00000080). A close above with sustained volume could target $0.00000095. Failure to break risks a drop to $0.00000075.
Actionable Insight:
Long on a close ab

Bearish Trendline Resistance at $0.00000085Analysis:
ASX:FHE faces a descending trendline resistance at $0.00000085 on the 4-hour chart. The price is consolidating below this level, with RSI at 45, showing no strong momentum. A rejection could push prices back to $0.00000070, while a breakout targets $0.0000010.
Actionable Insight:
Short o

Stochastic Oversold, Scalping OpportunityAnalysis:
On the 15-minute chart, ASX:FHE ’s Stochastic oscillator is oversold below 20, indicating potential for a quick bounce from $0.00000079. The price is near the lower Bollinger Band, reinforcing the setup. A move to the middle band ($0.00000083) is plausible. Low liquidity warrants tight st

Testing 200-EMA Support, Reversal or Breakdown?ASX:FHE is testing the 200-day EMA at $0.00000078 on the daily chart, a level that has acted as support in past consolidations. RSI is neutral at 40, offering no clear overbought/oversold signal. A bounce could push prices to $0.0000010, while a break below risks $0.00000060. Low volume suggests in

Bullish MACD Crossover Signals Short-Term BounceASX:FHE ’s 1-hour chart shows a bullish MACD crossover, with the MACD line crossing above the signal line at $0.00000079. This suggests short-term bullish momentum, supported by a slight uptick in trading volume. The price is approaching the 20-period EMA ($0.00000082), a key dynamic resistance. A b

See all ideas
Summarizing what the indicators are suggesting.
Oscillators
Neutral
SellBuy
Strong sellStrong buy
Strong sellSellNeutralBuyStrong buy
Oscillators
Neutral
SellBuy
Strong sellStrong buy
Strong sellSellNeutralBuyStrong buy
Summary
Neutral
SellBuy
Strong sellStrong buy
Strong sellSellNeutralBuyStrong buy
Summary
Neutral
SellBuy
Strong sellStrong buy
Strong sellSellNeutralBuyStrong buy
Summary
Neutral
SellBuy
Strong sellStrong buy
Strong sellSellNeutralBuyStrong buy
Moving Averages
Neutral
SellBuy
Strong sellStrong buy
Strong sellSellNeutralBuyStrong buy
Moving Averages
Neutral
SellBuy
Strong sellStrong buy
Strong sellSellNeutralBuyStrong buy