FHE/USDT Analysis – High Probability of a Bullish Trend
This futures pair is showing strong signs of entering a full-fledged bullish trend.
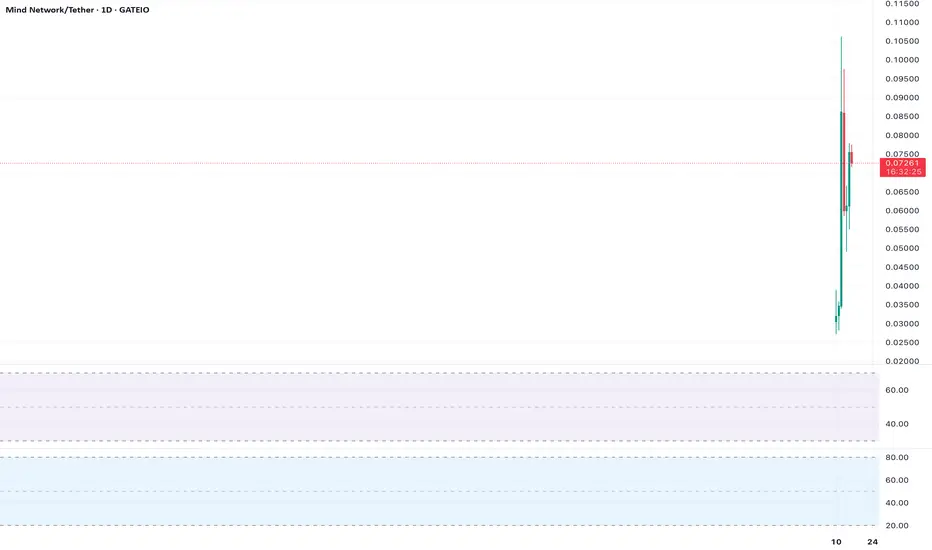
We are currently attempting to break through the key level of $0.078.
Below that, a strong volume zone has formed at $0.0756–$0.072, which is now acting as support.
We're looking at a potential long position upon a retest and confirmation from that zone.
The upside potential is open-ended.
FHEUSDT.P trade ideas

FHE PERPETUAL TRADE Sold at $0.088FHE PERPETUAL TRADE
FHEUSDT SELL SETUP
Currently $0.087
Sold at $0.088
(Trading plan If FHE/USDT up to $0.10 we will add more shorts)
Expecting target $0.08 OR DOWN
Incase of early exist will update this anaylsis
Its not a Financial advice

Fibonacci Retracement Points to $0.0000010 TargetAnalysis:
ASX:FHE ’s 1-day chart shows the price at $0.00000079, near the 61.8% Fibonacci retracement level from a prior swing high ($0.0000015) to low ($0.00000050). A bounce from this level could target the 38.2% retracement at $0.0000010. RSI is neutral at 42.
Actionable Insight:
Long at $0.00000079, targeting $0.0000010. Stop-loss at $0.00000070. Confirm with broader altcoin market strength.
Chart Setup:
Timeframe: Daily
Indicators: Fibonacci Retracement, RSI
Levels: Support ($0.00000079), Target ($0.0000010)

Ichimoku Cloud Resistance Looms at $0.00000090Analysis:
On the 4-hour chart, ASX:FHE is approaching the Ichimoku Cloud’s lower edge at $0.00000090. The price is at $0.00000079, with the Tenkan-sen crossing above the Kijun-sen, signaling short-term bullishness. A cloud breakout could target $0.0000012, but low liquidity adds risk.
Actionable Insight:
Long on a cloud breakout above $0.00000090, targeting $0.0000012. Stop-loss at $0.00000077. Avoid if volume is stagnant.
Chart Setup:
Timeframe: 4-hour
Indicators: Ichimoku Cloud, Tenkan/Kijun
Levels: Resistance ($0.00000090), Target ($0.0000012)

Double Bottom at $0.00000075 Signals ReversalAnalysis:
ASX:FHE ’s daily chart shows a potential double bottom at $0.00000075, a bullish pattern. The price is at $0.00000079, with RSI rising from oversold levels (30). A move above $0.00000085 confirms the pattern, targeting $0.0000011. Low volume is a risk.
Actionable Insight:
Long on a break above $0.00000085, targeting $0.0000011. Stop-loss at $0.00000074. Confirm with volume before entry.
Chart Setup:
Timeframe: Daily
Indicators: RSI, Double Bottom
Levels: Neckline ($0.00000085), Target ($0.0000011)
Volume Spike Could Ignite BreakoutAnalysis:
ASX:FHE ’s 1-hour chart shows a minor volume spike at $0.00000079, hinting at accumulation. The price is near the 50-period SMA ($0.00000080). A close above with sustained volume could target $0.00000095. Failure to break risks a drop to $0.00000075.
Actionable Insight:
Long on a close above $0.00000080 with volume, targeting $0.00000095. Stop-loss at $0.00000075. Monitor order book for liquidity.
Chart Setup:
Timeframe: 1-hour
Indicators: 50-period SMA, Volume
Levels: Resistance ($0.00000080), Target ($0.00000095)

Bearish Trendline Resistance at $0.00000085Analysis:
ASX:FHE faces a descending trendline resistance at $0.00000085 on the 4-hour chart. The price is consolidating below this level, with RSI at 45, showing no strong momentum. A rejection could push prices back to $0.00000070, while a breakout targets $0.0000010.
Actionable Insight:
Short on rejection at $0.00000085, targeting $0.00000070, or go long on a breakout with volume. Stop-loss 5% below/above entry.
Chart Setup:
Timeframe: 4-hour
Indicators: RSI, Trendline
Levels: Resistance ($0.00000085), Support ($0.00000070)

Stochastic Oversold, Scalping OpportunityAnalysis:
On the 15-minute chart, ASX:FHE ’s Stochastic oscillator is oversold below 20, indicating potential for a quick bounce from $0.00000079. The price is near the lower Bollinger Band, reinforcing the setup. A move to the middle band ($0.00000083) is plausible. Low liquidity warrants tight stops.
Actionable Insight:
Scalp long at $0.00000079, targeting $0.00000083. Stop-loss at $0.00000077. Exit within 1-2 hours due to volatility.
Chart Setup:
Timeframe: 15-minute
Indicators: Stochastic, Bollinger Bands
Levels: Target ($0.00000083), Stop ($0.00000077)

Testing 200-EMA Support, Reversal or Breakdown?ASX:FHE is testing the 200-day EMA at $0.00000078 on the daily chart, a level that has acted as support in past consolidations. RSI is neutral at 40, offering no clear overbought/oversold signal. A bounce could push prices to $0.0000010, while a break below risks $0.00000060. Low volume suggests indecision.
Actionable Insight:
Wait for a daily close above $0.00000078 for a long entry, targeting $0.0000010. Stop-loss at $0.00000075. Avoid trading if volume doesn’t pick up.
Chart Setup:
Timeframe: Daily
Indicators: 200-day EMA, RSI
Levels: Support ($0.00000078), Target ($0.0000010)

Bullish MACD Crossover Signals Short-Term BounceASX:FHE ’s 1-hour chart shows a bullish MACD crossover, with the MACD line crossing above the signal line at $0.00000079. This suggests short-term bullish momentum, supported by a slight uptick in trading volume. The price is approaching the 20-period EMA ($0.00000082), a key dynamic resistance. A break above could target $0.00000090, a 14% move. However, thin liquidity increases slippage risk.
Actionable Insight:
Go long on a break above $0.00000082, targeting $0.00000090. Set stop-loss at $0.00000077. Scalp cautiously due to low volume.
Chart Setup:
Timeframe: 1-hour
Indicators: MACD, 20-period EMA
Levels: Resistance ($0.00000082), Target ($0.00000090)

Falling Wedge Breakout Could Spark 100% RallyASX:FHE ’s price action on the 4-hour chart reveals a falling wedge pattern, a bullish setup often preceding sharp reversals in low-cap altcoins. The token is trading at $0.00000079, with the wedge’s upper trendline near $0.00000085 and support at $0.00000070. Falling wedges typically form during consolidation after a downtrend, and ASX:FHE ’s declining volume within the pattern supports this thesis. The Bollinger Bands are contracting, indicating low volatility and a potential breakout.
A breakout above $0.00000085, confirmed by a 4-hour close and a volume spike, could propel ASX:FHE to $0.0000016, a 100% gain, aligning with the pattern’s measured target (wedge height projected upward). The MACD is showing early signs of bullish convergence, with the signal line flattening below zero. However, low liquidity (24-hour volume ~$0) increases the risk of whipsaws, and a false breakout could see prices drop to $0.00000060. Sentiment for low-cap tokens is cautious, but a broader altcoin rally could catalyze ASX:FHE ’s move.
Actionable Insight:
Enter long on a confirmed breakout above $0.00000085 with volume. Target $0.0000016, with a stop-loss below $0.00000070. Monitor Bitcoin’s trend, as altcoins often follow BTC’s lead. Check MEXC’s order book for liquidity before trading.
Chart Setup:
Timeframe: 4-hour
Indicators: Bollinger Bands, MACD, Volume
Levels: Support ($0.00000070), Resistance ($0.00000085, $0.0000016)

Oversold RSI Signals Potential Reversal at Key SuppotASX:FHE is currently trading at $0.000000790640, near historical lows, with a market cap of just $79 and negligible 24-hour volume (CoinBrain). On the daily chart, ASX:FHE appears to be testing a critical support zone around $0.00000075-$0.00000080, a level that has held during previous sell-offs. The 14-day Relative Strength Index (RSI) is deep in oversold territory at 25, suggesting selling pressure may be exhausted. A bullish divergence is forming, with price making lower lows while RSI shows higher lows, hinting at weakening bearish momentum.
The 50-day Exponential Moving Average (EMA) sits at $0.00000095, acting as dynamic resistance. A break above this level could trigger a short-term rally toward $0.0000012, a 50% move from current prices, aligning with the 200-day EMA. Volume remains thin, typical for micro-cap tokens, but a spike in buying volume could confirm the reversal. On the downside, a break below $0.00000075 risks further capitulation to $0.00000050, though low liquidity makes precise targets tricky.
Actionable Insight:
Watch for a daily close above $0.00000095 with increased volume to confirm bullish momentum. Set stop-loss below $0.00000075 to manage downside risk. High volatility expected, so position size cautiously. Use MEXC or other low-liquidity exchanges for real-time data.
Chart Setup:
Timeframe: Daily
Indicators: RSI (14), 50-day EMA, 200-day EMA, Volume
Levels: Support ($0.00000075), Resistance ($0.00000095, $0.0000012)

$FHE – 4H Chart Fibonacci PlayThe 4-hour chart shows ASX:FHE testing the 61.8% Fibonacci level at $0.076. The 200-period MA adds support. RSI at 50 is neutral; MACD hints at bullish momentum.
A bounce could hit $0.085; below $0.073 targets $0.065.
Trading Plan: Buy at $0.076, stop loss at $0.073, take profit at $0.085. Short below $0.073, targeting $0.065. Confirm volume.

$FHE – Daily Chart Ichimoku SignalASX:FHE on the daily chart is below the Ichimoku Cloud, bearish, but the Tenkan-sen ($0.078) crosses above the Kijun-sen ($0.075), hinting at bullish momentum. RSI at 48 is neutral.
Above $0.080 targets $0.090; below $0.075 hits $0.065.
Trading Plan: Buy at $0.078, stop loss at $0.073, take profit at $0.090. Short below $0.075, targeting $0.065. Watch cloud resistance.

$FHE – 1H Chart Scalping SetupOn the 1-hour chart, ASX:FHE ranges between $0.075 and $0.085. ADX below 20 signals a weak trend, ideal for scalping. RSI at 50 is neutral; price hugs the 100-period MA.
Buy dips to $0.075, sell rallies to $0.085.
Trading Plan: Buy at $0.075, stop loss at $0.073, take profit at $0.085. Short at $0.085, stop loss at $0.087, take profit at $0.075.

$FHE – 4H Chart Falling WedgeASX:FHE on the 4-hour chart forms a falling wedge, a bullish pattern. Price nears $0.074, with RSI at 42 showing bullish divergence. The 50-period EMA at $0.080 is resistance.
A breakout above $0.080 could hit $0.090; below $0.070 targets $0.060.
Trading Plan: Buy at $0.075, stop loss at $0.070, take profit at $0.090. Short below $0.070, targeting $0.060. Watch wedge volume.

$FHE – Weekly Chart Support TestThe weekly chart shows ASX:FHE holding $0.065 support, with Stochastic RSI rising from oversold levels, hinting at a reversal. The 20-week MA at $0.090 is resistance. Volume spikes on dips suggest buying interest.
A close above $0.080 could target $0.090; below $0.065 aims for $0.050.
Trading Plan: Buy at $0.068, stop loss at $0.062, take profit at $0.090. Short below $0.065, targeting $0.050. Confirm with volume.

$FHE – Daily Chart Bearish RejectionASX:FHE rejected $0.095 resistance on the daily chart, forming a bearish pin bar. The price tests the 50-day MA at $0.078, with RSI at 45, showing fading momentum. OBV is flat, indicating no strong buying support.
A break below $0.078 could hit $0.065; a bounce may retest $0.095.
Trading Plan: Short at $0.078, stop loss at $0.082, take profit at $0.065. Buy above $0.080, targeting $0.095, stop at $0.076. Check volume trends.

$FHE – 1H Chart Bullish BounceOn the 1-hour chart, ASX:FHE bounced off $0.070 support, crossing the 50-period MA. The MACD shows a bullish crossover, and RSI at 58 indicates room for upside. Volume is rising, supporting the move. Resistance at $0.085 looms, aligning with the 200-period MA.
A push above $0.085 could target $0.095; below $0.070 risks $0.062.
Trading Plan: Buy at $0.072, stop loss at $0.068, take profit at $0.095. Short below $0.070, targeting $0.062. Monitor RSI for overbought conditions.

$FHE – 4H Chart Range-Bound ActionASX:FHE on the 4-hour chart is stuck in a range between $0.075 and $0.090, with the 20-period EMA flat, signaling indecision. Bollinger Bands are narrowing, hinting at an impending volatility spike. RSI at 50 is neutral, but a bullish divergence on lower lows suggests potential upside. Volume remains low, typical for consolidation.
A breakout above $0.090 could target $0.100, while a drop below $0.075 may hit $0.065.
Trading Plan: Buy at $0.077, stop loss at $0.073, take profit at $0.090–$0.100. Short below $0.075, targeting $0.065. Watch volume for breakout confirmation.

$FHE – Weekly Chart Double Bottom PotentialOn the weekly chart, ASX:FHE appears to be forming a double bottom near $0.065, a level that held as support twice in recent months, indicating strong buying interest. The price is now testing the 50-week MA at $0.085, a pivotal level for confirming a trend reversal. The Stochastic RSI is climbing from oversold territory (below 20), suggesting diminishing selling pressure and potential for a bullish move. However, the Awesome Oscillator remains in negative territory, indicating that momentum is still weak—bulls need a flip to green bars for confirmation.
A Fibonacci retracement from the recent high to low projects resistance at $0.110 (50% level) and $0.140 (78.6% level), viable targets if the double bottom confirms. The Ichimoku Cloud at $0.150 poses a longer-term hurdle. On the downside, a failure to hold $0.065 could see prices slide to $0.050, invalidating the pattern. Volume spikes on dips suggest accumulation, but low overall volume warrants caution.
Trading Plan:
Buy Zone: $0.068–$0.070 (near neckline).
Stop Loss: $0.062.
Take Profit: $0.110, $0.140.
Bearish Scenario: Short below $0.065, targeting $0.050.
Traders should watch for a weekly close above $0.085 to validate the bullish setup. Project-specific catalysts, like Mind Network updates, could drive volatility. Always diversify risk— ASX:FHE ’s low liquidity may amplify price swings. Check TradingView’s community for sentiment and cross-market correlations before acting.

$FHE – Daily Chart Symmetrical Triangle SetupThe ASX:FHE token on the daily chart is forming a symmetrical triangle, signaling a period of consolidation after a volatile uptrend. The price is oscillating between converging trendlines, with support at $0.070 and resistance at $0.095, suggesting a breakout is imminent. The 50-day moving average (MA) is trending above the 200-day MA, maintaining a bullish bias, but the flattening MAs indicate fading momentum. The Relative Strength Index (RSI) at 52 shows neutral conditions, with no clear overbought or oversold signals. The MACD is converging toward the signal line, hinting at a potential crossover that could dictate direction.
Volume has been declining within the triangle, typical before a breakout, but recent spikes suggest accumulation. A close above $0.095 with strong volume could target $0.120 (a 26% move), aligning with the 1.618 Fibonacci extension. Conversely, a break below $0.070 may test $0.058, a key support from prior lows. On-chain data (if available) showing increased wallet activity could bolster the bullish case, but broader crypto market sentiment remains a factor.
Trading Plan:
Buy Zone: $0.072–$0.075 (near support).
Stop Loss: $0.068.
Take Profit: $0.095, $0.120.
Bearish Scenario: Short below $0.070, targeting $0.058.
Traders should monitor Bitcoin’s price action, as altcoins like ASX:FHE often correlate. Risk management is critical—use tight stops and avoid over-leveraging in this volatile market. Confirm breakouts with volume before entering trades.
