Super bullish from both Fundamental and Technical perspective
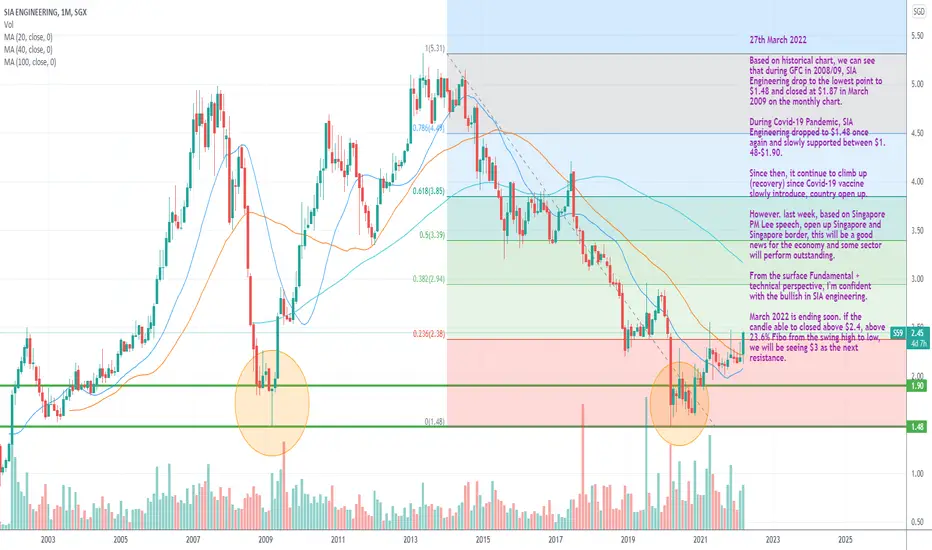
Based on historical chart, we can see that during GFC in 2008/09, SIA Engineering drop to the lowest point to $1.48 and closed at $1.87 in March 2009 on the monthly chart.
During Covid-19 Pandemic, SIA Engineering dropped to $1.48 once again and slowly supported between $1.48-$1.90.
Since then, i
Next report date
—
Report period
—
EPS estimate
—
Revenue estimate
—
0.08 EUR
96.00 M EUR
856.53 M EUR
242.06 M
About SIA ENGINEERING
Sector
Industry
CEO
Yau Seng Chin
Website
Headquarters
Singapore
Founded
1982
ISIN
SG1I53882771
FIGI
BBG001PC1QV0
SIA Engineering Co. Ltd. provides airframe maintenance, component overhaul services and fleet management business, line maintenance and technical ground handling services, and investment holdings. It operates through the Airframe and Line Maintenance, and Engine and Component segments. The Airframe and Line Maintenance segment provides airframe maintenance, line maintenance, and fleet management business. The Engine and Component segment includes component overhaul and engine repair and overhaul services. The company was founded on March 16, 1982, and is headquartered in Singapore.
Related stocks

SGX SIA Engineering Neutralstock is in a wedge, depending on next movement, to long or short depending if it breaks above resistance or support


SIA Engineering (Downtrend)Short term (4h) - Bear , Mid term (Day) - Bear , Long term (mth) - Bear
Highly possible that the downtrend will continue until it hits the next support level. No significant volume/candle pattern to indicate a reversal in the trend.
P.S - Remember to ride on the wave trend. The trend is your best

See all ideas
Summarizing what the indicators are suggesting.
Neutral
SellBuy
Strong sellStrong buy
Strong sellSellNeutralBuyStrong buy
Neutral
SellBuy
Strong sellStrong buy
Strong sellSellNeutralBuyStrong buy
Neutral
SellBuy
Strong sellStrong buy
Strong sellSellNeutralBuyStrong buy
An aggregate view of professional's ratings.
Neutral
SellBuy
Strong sellStrong buy
Strong sellSellNeutralBuyStrong buy
Neutral
SellBuy
Strong sellStrong buy
Strong sellSellNeutralBuyStrong buy
Neutral
SellBuy
Strong sellStrong buy
Strong sellSellNeutralBuyStrong buy
Displays a symbol's price movements over previous years to identify recurring trends.
Frequently Asked Questions
The current price of O3H is 2.20 EUR — it hasn't changed in the past 24 hours. Watch SIA ENGINEERING CO. stock price performance more closely on the chart.
Depending on the exchange, the stock ticker may vary. For instance, on FWB exchange SIA ENGINEERING CO. stocks are traded under the ticker O3H.
O3H stock has risen by 3.77% compared to the previous week, the month change is a 0.92% rise, over the last year SIA ENGINEERING CO. has showed a 37.50% increase.
We've gathered analysts' opinions on SIA ENGINEERING CO. future price: according to them, O3H price has a max estimate of 2.36 EUR and a min estimate of 1.82 EUR. Watch O3H chart and read a more detailed SIA ENGINEERING CO. stock forecast: see what analysts think of SIA ENGINEERING CO. and suggest that you do with its stocks.
O3H stock is 0.00% volatile and has beta coefficient of 0.60. Track SIA ENGINEERING CO. stock price on the chart and check out the list of the most volatile stocks — is SIA ENGINEERING CO. there?
Today SIA ENGINEERING CO. has the market capitalization of 2.51 B, it has increased by 3.21% over the last week.
Yes, you can track SIA ENGINEERING CO. financials in yearly and quarterly reports right on TradingView.
SIA ENGINEERING CO. is going to release the next earnings report on Oct 31, 2025. Keep track of upcoming events with our Earnings Calendar.
O3H net income for the last half-year is 48.70 M EUR, while the previous report showed 48.05 M EUR of net income which accounts for 1.37% change. Track more SIA ENGINEERING CO. financial stats to get the full picture.
SIA ENGINEERING CO. dividend yield was 4.13% in 2024, and payout ratio reached 72.23%. The year before the numbers were 3.54% and 92.49% correspondingly. See high-dividend stocks and find more opportunities for your portfolio.
EBITDA measures a company's operating performance, its growth signifies an improvement in the efficiency of a company. SIA ENGINEERING CO. EBITDA is 54.55 M EUR, and current EBITDA margin is 6.38%. See more stats in SIA ENGINEERING CO. financial statements.
Like other stocks, O3H shares are traded on stock exchanges, e.g. Nasdaq, Nyse, Euronext, and the easiest way to buy them is through an online stock broker. To do this, you need to open an account and follow a broker's procedures, then start trading. You can trade SIA ENGINEERING CO. stock right from TradingView charts — choose your broker and connect to your account.
Investing in stocks requires a comprehensive research: you should carefully study all the available data, e.g. company's financials, related news, and its technical analysis. So SIA ENGINEERING CO. technincal analysis shows the buy rating today, and its 1 week rating is strong buy. Since market conditions are prone to changes, it's worth looking a bit further into the future — according to the 1 month rating SIA ENGINEERING CO. stock shows the buy signal. See more of SIA ENGINEERING CO. technicals for a more comprehensive analysis.
If you're still not sure, try looking for inspiration in our curated watchlists.
If you're still not sure, try looking for inspiration in our curated watchlists.