GBPJPY: Bullish Impulse May Take Price To 205! 700+ Pips MoveGBPJPY is in steady bullish move in other words it is in impulse move; price has not yet exhausted and there is still extended bullish move to completed before bears takes control over. Please use accurate risk management while trading and do your own analysis.
LIKE
COMMENT
SHARE
Good luck.
Te
About British Pound / Japanese Yen
The British Pound (GBP) vs. the Japanese Yen (JPY) is a highly volatile pair. JPY is often used as a funding currency of a trade because it’s historically a low yielding currency. Since UK is one of the larger economies in Europe, the GBPJPY pair can be considered as a proxy for worldwide economic health. On the other hand, this pair performs like a representer for market 'risk-off' moves as the carry trade gets reversed. As a result, GBPJPY is able to develop strong trends that exceed thousands of pips.
Related currencies

GBPJPY H4 XABCD Short at Market TP Below Market🔸Hello traders, let's review the 4 hour chart for GBPJPY. Strong gains off the lows recently, however price getting overextended and expecting reversal later at/near PRZ/D.
🔸Speculative XABCD structure defined by point X 199 point A 188 point B 195.20 point C 186.80 point D/PRZ 198.40/80 .
🔸Curren

GBPJPY sitting at resistance – Is a drop to 193.360 likely?GBPJPY is sitting right at a key daily resistance zone. This is a level where it has struggled to break through and reversed strongly to the downside. So this makes it definitely one to monitor, especially if you’re eyeing potential short setups.
If we start seeing signs that the price is getting

GBP/JPY Best Place To Buy Very Clear , Let`s Get This 200 Pips !Here is my 4H T.F Chart and if we check we will see that we have a very good support area very near the price now and we have already a good breakout and the price never retest the broken res and new supp so i`m waiting the price to retest it and give me any bullish price action and then we can buy

GBPJPY Eyes 200 BoJ Dovishness & Bullish UK SentimentGBPJPY pair has staged a decisive breakout from a multi-day consolidation zone, with technical momentum and macro fundamentals aligning in favor of further upside. Price action has respected a bullish continuation structure — a falling wedge followed by horizontal accumulation — and is now pressing

GBPJPY: A Short-Term Bullish OutlookGBPJPY: A Short-Term Bullish Outlook
This move is more related to the BOJ’s uncertainty about rising inflation, and the Bank of Japan is not taking further actions.
On the other hand, one day the BOJ says it will raise interest rates again, and the next day it says the opposite. They are losing

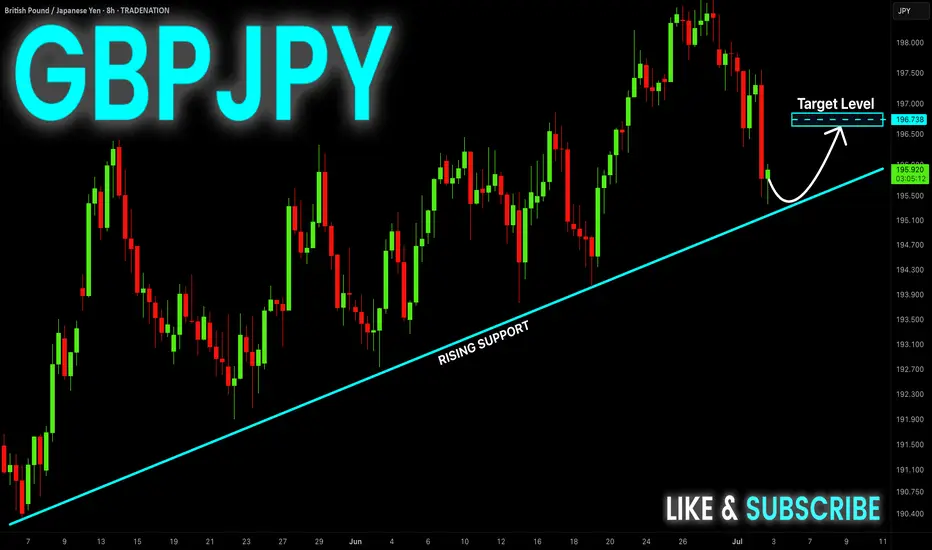
GBP-JPY Correction Ahead! Buy!
Hello,Traders!
GBP-JPY will soon make
A retest of the rising support
Line and as we are bullish
Biased we will be expecting
A local bullish correction
Buy!
Comment and subscribe to help us grow!
Check out other forecasts below too!
Disclosure: I am part of Trade Nation's Influencer program
GBP/JPY Bullish Flag (25.06.2025) The GBP/JPY pair on the M30 timeframe presents a Potential Buying Opportunity due to a recent Formation of a Bullish Flag Pattern. This suggests a shift in momentum towards the upside and a higher likelihood of further advances in the coming hours.
Possible Long Trade:
Entry: Consider Entering A

GBPJPY Potential UpsidesHey Traders, in the coming week we are monitoring GBPJPY for a buying opportunity around 198.100 zone, GBPJPY is trading in an uptrend and currently is in a correction phase in which it is approaching the trend at 198.100 support and resistance area.
Trade safe, Joe.

GBP/JPY BULLISH BIAS RIGHT NOW| LONG
Hello, Friends!
It makes sense for us to go long on GBP/JPY right now from the support line below with the target of 198.556 because of the confluence of the two strong factors which are the general uptrend on the previous 1W candle and the oversold situation on the lower TF determined by it’s p

See all ideas
Summarizing what the indicators are suggesting.
Oscillators
Neutral
SellBuy
Strong sellStrong buy
Strong sellSellNeutralBuyStrong buy
Oscillators
Neutral
SellBuy
Strong sellStrong buy
Strong sellSellNeutralBuyStrong buy
Summary
Neutral
SellBuy
Strong sellStrong buy
Strong sellSellNeutralBuyStrong buy
Summary
Neutral
SellBuy
Strong sellStrong buy
Strong sellSellNeutralBuyStrong buy
Summary
Neutral
SellBuy
Strong sellStrong buy
Strong sellSellNeutralBuyStrong buy
Moving Averages
Neutral
SellBuy
Strong sellStrong buy
Strong sellSellNeutralBuyStrong buy
Moving Averages
Neutral
SellBuy
Strong sellStrong buy
Strong sellSellNeutralBuyStrong buy
Displays a symbol's price movements over previous years to identify recurring trends.
Frequently Asked Questions
The current rate of GBPJPY is 197.378 JPY — it has increased by 0.23% in the past 24 hours. See more of GBPJPY rate dynamics on the detailed chart.
The value of the GBPJPY pair is quoted as 1 GBP per x JPY. For example, if the pair is trading at 1.50, it means it takes 1.5 JPY to buy 1 GBP.
The term volatility describes the risk related to the changes in an asset's value. GBPJPY has the volatility rating of 0.29%. Track all currencies' changes with our live Forex Heatmap and prepare for markets volatility.
The GBPJPY showed a −0.96% fall over the past week, the month change is a 1.64% rise, and over the last year it has decreased by −4.10%. Track live rate changes on the GBPJPY chart.
Learn how you can make money on rate changes in numerous trading ideas created by our community.
Learn how you can make money on rate changes in numerous trading ideas created by our community.
GBPJPY is a minor currency pair, i.e. a popular pair that is not associated with USD. Such pairs are also called cross currency pairs.
Currencies are usually traded through forex brokers — choose the one that suits your needs and go ahead. You can trade GBPJPY right from TradingView charts — just log in to you broker account. Check out the list of our integrated brokers and find the best one for your needs and strategy.
When deciding to buy or sell currency one should keep in mind many factors including current geopolitical situation, interest rates, and other. But before plunging into a deep research, you can start with GBPJPY technical analysis. The technical rating for the pair is buy today, but don't forget that markets can be very unstable, so don't stop here. According to our 1 week rating the GBPJPY shows the buy signal, and 1 month rating is buy. See more of GBPJPY technicals for a more comprehensive analysis.