GRT Short Term BullishOverall this crypto is very weak. Most alts are weak, with few exceptions. The Graph has actually been non-stop building even though the coin has bled out for 4+ years. I doubt the long-term trend is bullish, but on the short term, it looks like a standard head and shoulders pattern on the 1-hour.

GRT. USDTThe Graph(GRT) is a Web 3 project that is used to search data from other platforms, such as Ethereum.
Similarly, AI (Artificial intelligence) developers can use it to promote their services.
And it has been in a neutral trend for a long time after a sharp correction.
Therefore, the probability of pr

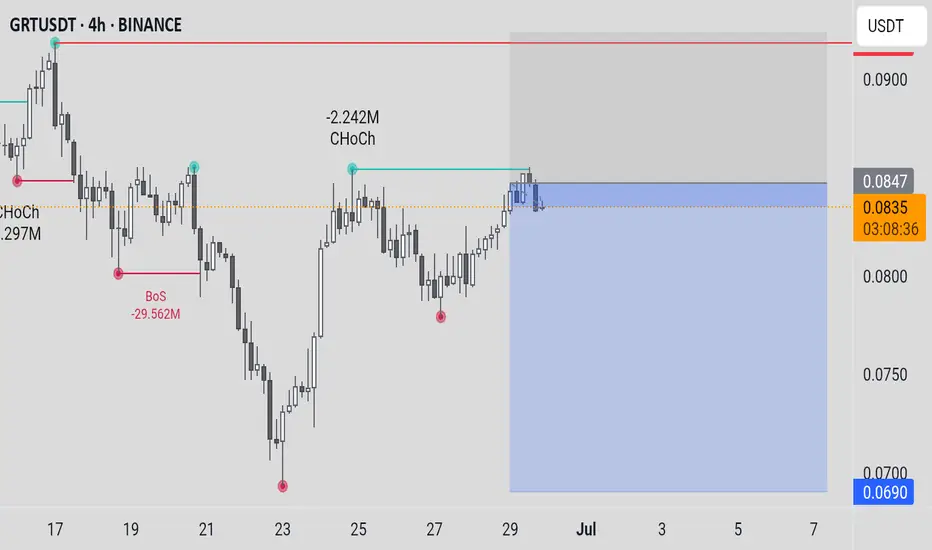
Wave structure of GRT coin in week time frame- Week is swing bullish => current is pullback.
- Day is swing bullish => current is pullback.
- We can look for buying opportunities when there is a reversal signal on the 4-hour time frame or the price reaches the demand zone of the daily frame.

Nice Bounce for GRT - What's next? *4 Hour Charting*I re-entered a trade at the 50ma (on the 4-hour) for a significantly smaller position than my previous trade where I went 40x long. There is no leverage here - not because I lack confidence in the trade, but because risk management is the single most important think you can do to protect yourself..

GRT/USDT Short Setup – Fib Reversal Play + Divergence Signals Targeting a short entry on GRT/USDT after key signs of exhaustion and overextension.
🔹 Fib Tool anchored from local bottom at ~$0.08185 to top ~$0.10015
🔹 Currently testing 0.236 retracement at ~$0.09650 after rejection near top of BB
🔹 Bearish divergence forming on RSI (Lower High) vs. price (High

Is a Breakout Imminent for #GRT or Another Bull Trap is Ahead?Yello, Paradisers! Are we looking at a clean breakout setup that could send #GRT flying or is this the perfect trap to wipe out early bulls? Let's see the latest #GRTUSDT moves:
💎The daily chart on #GRTUSD is showing a perfectly formed descending channel, with price now hovering just above the lowe

GRT/USDT at a Critical Point! Reversal Structure or Breakdown?📊 Full Technical Analysis – GRT/USDT (1W Timeframe)
🔎 Overview:
GRT is currently positioned at one of the most critical technical levels in its long-term structure. After a prolonged downtrend from the $2.88 all-time high, price is once again testing the historical demand zone between $0.07 – $0.0

GRT/USDT: The Graph's Phoenix Rising - A Technical Deep Dive🎯 The Trading Strategy : ⚠️ The Reality Check
Let's be honest - this trade isn't without risks...
Entry Strategy:
The Golden Support Zone : 0.05-0.055 (ALL TIME LOW levels)
⚡Target 1: $0.11
⚡Target 2: $0.13
⚡Target 3: midlle of 1W FVG
🔥 Risk/Reward: 4:1 🔥
_________________
Risk Management:
Stop

GRTJSE:GRT has formed a symmetrical triangle. Measuring the triangle’s range to its breakout gives a target around $15. This one is often called the Google of DeFi

GRTUSDTCryptocurrency Futures Market Disclaimer 🚨🚨🚨
Trading cryptocurrency futures involves high risks and is not suitable for all investors.
Cryptocurrency prices are highly volatile, which can lead to significant gains or losses in a short period.
Before engaging in crypto futures trading, consider you
See all ideas
Summarizing what the indicators are suggesting.
Oscillators
Neutral
SellBuy
Strong sellStrong buy
Strong sellSellNeutralBuyStrong buy
Oscillators
Neutral
SellBuy
Strong sellStrong buy
Strong sellSellNeutralBuyStrong buy
Summary
Neutral
SellBuy
Strong sellStrong buy
Strong sellSellNeutralBuyStrong buy
Summary
Neutral
SellBuy
Strong sellStrong buy
Strong sellSellNeutralBuyStrong buy
Summary
Neutral
SellBuy
Strong sellStrong buy
Strong sellSellNeutralBuyStrong buy
Moving Averages
Neutral
SellBuy
Strong sellStrong buy
Strong sellSellNeutralBuyStrong buy
Moving Averages
Neutral
SellBuy
Strong sellStrong buy
Strong sellSellNeutralBuyStrong buy