Our opinion on the current state of GTCSA(GTC)GTC is a property group operating in Central and Eastern Europe. The company has properties in Poland, Bucharest, Budapest, Belgrade, Sofia, and Zagreb. It manages forty-seven office buildings and six retail properties with a gross lettable area (GLA) of 829,000 square meters, valued at approximatel
2 ZAR
1.01 B ZAR
3.74 B ZAR
549.89 M
About GTC
Sector
Industry
CEO
Malgorzata Czaplicka
Website
Headquarters
Warsaw
Founded
1994
ISIN
PLGTC0000037
FIGI
BBG00D8X6ZD2
Globe Trade Centre SA engages in the business of developing and renting office and retail space. It operates through the following geographical segments: Poland, Belgrade, Hungary, Bucharest, Zagreb, Sofia, and Other. The company was founded in 1994 and is headquartered in Warsaw, Poland.
Related stocks

Our opinion on the current state of GTCSA(GTC)GTC is a property group operating in Central and Eastern Europe with a diverse portfolio of properties in key cities such as Warsaw, Bucharest, Budapest, Belgrade, Sofia, and Zagreb. The company manages forty-seven office buildings and six retail properties with a gross lettable area (GLA) of 829,00

Our opinion on the current state of GTCSA(GTC)GTC is a property group operating in Central and Eastern Europe, with properties in Poland, Bucharest, Budapest, Belgrade, Sophia, and Zagreb. The company manages forty-seven office buildings and six retail properties with a gross lettable area (GLA) of 829,000 square meters, worth about 2.35 billio

Our opinion on the current state of GTCSA(GTC)GTC, or Globe Trade Centre, is a significant player in the real estate market of Central and Eastern Europe, managing a substantial portfolio of properties across several key cities including Warsaw, Bucharest, Budapest, Belgrade, Sofia, and Zagreb. The company's operations encompass forty-seven off
See all ideas
Summarizing what the indicators are suggesting.
Neutral
SellBuy
Strong sellStrong buy
Strong sellSellNeutralBuyStrong buy
Neutral
SellBuy
Strong sellStrong buy
Strong sellSellNeutralBuyStrong buy
Neutral
SellBuy
Strong sellStrong buy
Strong sellSellNeutralBuyStrong buy
An aggregate view of professional's ratings.
Neutral
SellBuy
Strong sellStrong buy
Strong sellSellNeutralBuyStrong buy
Neutral
SellBuy
Strong sellStrong buy
Strong sellSellNeutralBuyStrong buy
Neutral
SellBuy
Strong sellStrong buy
Strong sellSellNeutralBuyStrong buy
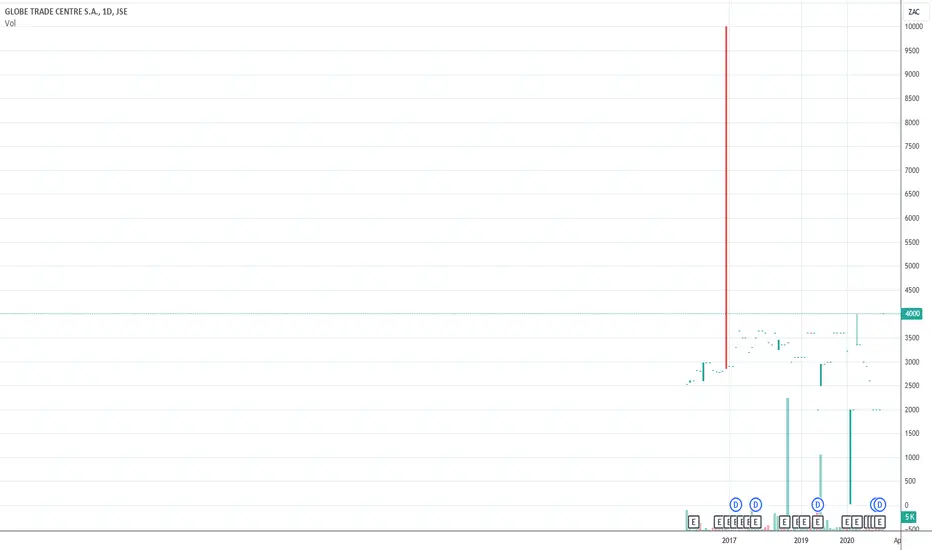
Displays a symbol's price movements over previous years to identify recurring trends.
Frequently Asked Questions
The current price of GTC is 3,000 ZAC — it has decreased by −25.00% in the past 24 hours. Watch GLOBE TRADE CENTRE S.A. stock price performance more closely on the chart.
Depending on the exchange, the stock ticker may vary. For instance, on JSE exchange GLOBE TRADE CENTRE S.A. stocks are traded under the ticker GTC.
We've gathered analysts' opinions on GLOBE TRADE CENTRE S.A. future price: according to them, GTC price has a max estimate of 2,753.98 ZAC and a min estimate of 1,812.23 ZAC. Watch GTC chart and read a more detailed GLOBE TRADE CENTRE S.A. stock forecast: see what analysts think of GLOBE TRADE CENTRE S.A. and suggest that you do with its stocks.
GTC stock is 33.33% volatile and has beta coefficient of 0.18. Track GLOBE TRADE CENTRE S.A. stock price on the chart and check out the list of the most volatile stocks — is GLOBE TRADE CENTRE S.A. there?
Today GLOBE TRADE CENTRE S.A. has the market capitalization of 11.39 B, it has increased by 0.47% over the last week.
Yes, you can track GLOBE TRADE CENTRE S.A. financials in yearly and quarterly reports right on TradingView.
GTC net income for the last quarter is 20.00 M ZAR, while the quarter before that showed 217.62 M ZAR of net income which accounts for −90.81% change. Track more GLOBE TRADE CENTRE S.A. financial stats to get the full picture.
Yes, GTC dividends are paid annually. The last dividend per share was 1.01 ZAR. As of today, Dividend Yield (TTM)% is 5.41%. Tracking GLOBE TRADE CENTRE S.A. dividends might help you take more informed decisions.
As of Jun 25, 2025, the company has 242 employees. See our rating of the largest employees — is GLOBE TRADE CENTRE S.A. on this list?
EBITDA measures a company's operating performance, its growth signifies an improvement in the efficiency of a company. GLOBE TRADE CENTRE S.A. EBITDA is 2.14 B ZAR, and current EBITDA margin is 56.22%. See more stats in GLOBE TRADE CENTRE S.A. financial statements.
Like other stocks, GTC shares are traded on stock exchanges, e.g. Nasdaq, Nyse, Euronext, and the easiest way to buy them is through an online stock broker. To do this, you need to open an account and follow a broker's procedures, then start trading. You can trade GLOBE TRADE CENTRE S.A. stock right from TradingView charts — choose your broker and connect to your account.
Investing in stocks requires a comprehensive research: you should carefully study all the available data, e.g. company's financials, related news, and its technical analysis. So GLOBE TRADE CENTRE S.A. technincal analysis shows the sell today, and its 1 week rating is sell. Since market conditions are prone to changes, it's worth looking a bit further into the future — according to the 1 month rating GLOBE TRADE CENTRE S.A. stock shows the sell signal. See more of GLOBE TRADE CENTRE S.A. technicals for a more comprehensive analysis.
If you're still not sure, try looking for inspiration in our curated watchlists.
If you're still not sure, try looking for inspiration in our curated watchlists.