Link long - zoom in on weekly closeWe are approaching a breakout.
Maybe this week's close is the trigger that all the bulls (and altcoins) have been waiting for.
Generally speaking, I don't like trading Chainlink. Although if we see a weekly close just above 14.2, above the 20 MA, I think it could be a good investment entry.
I think Chainlink will be one of the utility coins that completely explodes before retail has time to react. A good weekly close is something that smart money probably would appreciate. If you think long-term, I think Chainlink is in a good position with good upside without any immediate big risk.
LINKUSD trade ideas

CHAINLINK (LINKUSD): Very Bullish Outlook
I see 2 strong bullish confirmations on LinkUSD on a daily time frame.
The price violated 2 significant structures: a vertical falling resistance - a trend line
and a neckline of an inverted head & shoulders pattern.
With a high probability, the market will rise more.
Next resistance - 15.38
❤️Please, support my work with like, thank you!❤️

Possibly leg up?BIST:LINK we are in very overbought territoty so a pullback back to $14.1 ~ $13.90 range would not be surprising, HOWEVER, hourly charts still show some very bullish signals. MACD and STOCH RSI showing theres an attempt being mode for another leg up in the next few hours.

Crucial hour for $LINKAfter a massive leg up, longer time frame charts show there’s still some left in the tank but the hourly chart beg to differs.
First time today that we have the MACD touching and on the brink of a crossover to the down-side along with then stoch RSI on longer time frames showing a downtrend now.
The rising volume is encouraging and we will need a very strong hourly push here shortly if we want to keep the party going.

The Oracle Singularity: CHAINLINK is Inevitable or Cooked?How many marines are tracking this ascending channel?
How many are watching this Fibonacci time sequence unfold?
How many are following the mirrored bar fractal that might just be a crystal ball into the future?
Today you get all three in one TA. The value here is absurdly high . Even though I offloaded most of my LINK a while back it continues to act like a compass for future macro crypto moves.
You really need to look at the TA to understand what I mean
Now look at this
The deviation in the LINK bar pattern seems to be reaching its conclusion around mid October 2025 and if you’ve seen my last Bitcoin TA you know I’ve been targeting that same mid October 2025 window for a potential BTC top. That’s a serious timeline confluence.
But here's the twist
The main chart projects a $200 LINK by April 2026. If that plays out then I have to entertain the possibility that this cycle extends past my original thesis and that my Bitcoin top call may come in earlier than Chainlink's final move.
If Bitcoin does in fact top in mid October then LINK likely won’t have the legs to hit those upper targets.
Back in 2021 when LINK was trading at a similar price it only took 119 days to reach $50 that would put us at November 2025 for a repeat. Something doesn’t quite add up
Now check the main chart again
This Fibonacci time sequence is liquid gold. It’s nailed major tops and bottoms for years (see the blue circles). Every major move has hit right on time except for the 3.618 in October 2022 which was a rare miss.
But here's the kicker
There’s no Fib time event between October and December 2025. The next ones are in August 2025 and then April 2026
So is LINK trying to tell us the cycle extends into 2026?
Maybe. All I’ll say is this
If the cycle doesn’t extend into 2026 then LINK IS COOKED

LINKUSDT Cryptocurrency Futures Market Disclaimer 🚨🚨🚨
Trading cryptocurrency futures involves high risks and is not suitable for all investors.
Cryptocurrency prices are highly volatile, which can lead to significant gains or losses in a short period.
Before engaging in crypto futures trading, consider your risk tolerance, experience, and financial situation.
Risk of Loss: You may lose more than your initial capital due to the leveraged nature of futures. You are fully responsible for any losses incurred.
Market Volatility: Crypto prices can fluctuate significantly due to factors such as market sentiment, regulations, or unforeseen events.
Leverage Risk: The use of leverage can amplify profits but also increases the risk of total loss.
Regulatory Uncertainty: Regulations related to cryptocurrencies vary by jurisdiction and may change, affecting the value or legality of trading.
Technical Risks: Platform disruptions, hacking, or technical issues may result in losses.
This information is not financial, investment, or trading advice. Consult a professional financial advisor before making decisions. We are not liable for any losses or damages arising from cryptocurrency futures trading.
Note: Ensure compliance with local regulations regarding cryptocurrency trading in your region.
thanks for like and follow @ydnldn to have more information outlook and free signal.
About me :
"I am a passionate swing trader focused on analyzing financial markets to capture profit opportunities from medium-term price movements. With a disciplined approach and in-depth technical analysis, I concentrate on identifying trends, support-resistance levels, and price patterns to make informed trading decisions. I prioritize strict risk management to protect capital while maximizing profit potential. Always learning and adapting to market dynamics, I enjoy the process of refining strategies to achieve consistency in trading."
LINKUSD – Caught in a Tug-of-WarLINK broke out impulsively above $15.60 yesterday but failed to sustain and pulled back into $15.00. Price is ranging now with lower highs and flat support. A clean flip of $15.45 is required for bulls to regain control. Below $15.10 risks continuation lower.

Final $LINK in the corrective chain?If you find this information inspiring/helpful, please consider a boost and follow! Any questions or comments, please leave a comment!
LINK could be finishing a double zigzag correction. Recent reaction at the channel’s most likely target area shows promise. Watching for an internal retrace that holds above key support.
Key Levels:
11.81: Ideal retrace floor
11.00: Break kills impulse idea
13.25: First upside flip needed
15.00: Big level to break for bulls
Bulls have been tricked before with possible impulse starts. This one has the right look and confluence, but caution is warranted. Ideally, we get consolidation and push above 13.25 to build confidence in further upside.
As long as price holds above 11.81 and builds higher lows, potential remains for an impulsive move up. Break below 11 and bias flips back to bearish continuation.
Trade Safe!
Trade Clarity!

Link Usd Long Set upA historical movement from December 2020/ January 2021 might be repeating in real time.
Stops @ 11.59.
Next update when required.

Long trade
📍 Pair: LINKUSD
📅 Date: Monday, June 23, 2025
🕒 Time: 11:00 AM (NY Session AM)
⏱ Time Frame: 4 Hour
📈 Direction: Buyside
📊 Trade Breakdown:
Entry Price 11.892
Profit Level 14.925 (+25.50%)
Stop Loss 11.408 (−4.07%)
Risk-Reward
Ratio 6.27 : 1
🧠 Context / Trade Notes:
High Timeframe Execution:
Trade executed from a 4-hour bullish order block, positioned at the base of a previous impulsive move.
Liquidity Engineering & Sweep:
The setup formed after a sweep below the previous 4H demand, collecting liquidity before reversing direction.

LINKUSDTCryptocurrency Futures Market Disclaimer
Trading cryptocurrency futures involves high risks and is not suitable for all investors. Cryptocurrency prices are highly volatile, which can lead to significant gains or losses in a short period. Before engaging in crypto futures trading, consider your risk tolerance, experience, and financial situation.
Risk of Loss: You may lose more than your initial capital due to the leveraged nature of futures. You are fully responsible for any losses incurred.
Market Volatility: Crypto prices can fluctuate significantly due to factors such as market sentiment, regulations, or unforeseen events.
Leverage Risk: The use of leverage can amplify profits but also increases the risk of total loss.
Regulatory Uncertainty: Regulations related to cryptocurrencies vary by jurisdiction and may change, affecting the value or legality of trading.
Technical Risks: Platform disruptions, hacking, or technical issues may result in losses.
This information is not financial, investment, or trading advice. Consult a professional financial advisor before making decisions. We are not liable for any losses or damages arising from cryptocurrency futures trading.
Note: Ensure compliance with local regulations regarding cryptocurrency trading in your region

ALTCOIN LINKUSDT FORECAST EYES ON 4-7JULY!"Wait until July 4–7. Do not trade next week, as it will be similar to the previous one.
I think Monday will be bearish, followed by bullish days on Tuesday, Wednesday, and Thursday. On Friday, the top will likely be set—then start shorting for the following week."

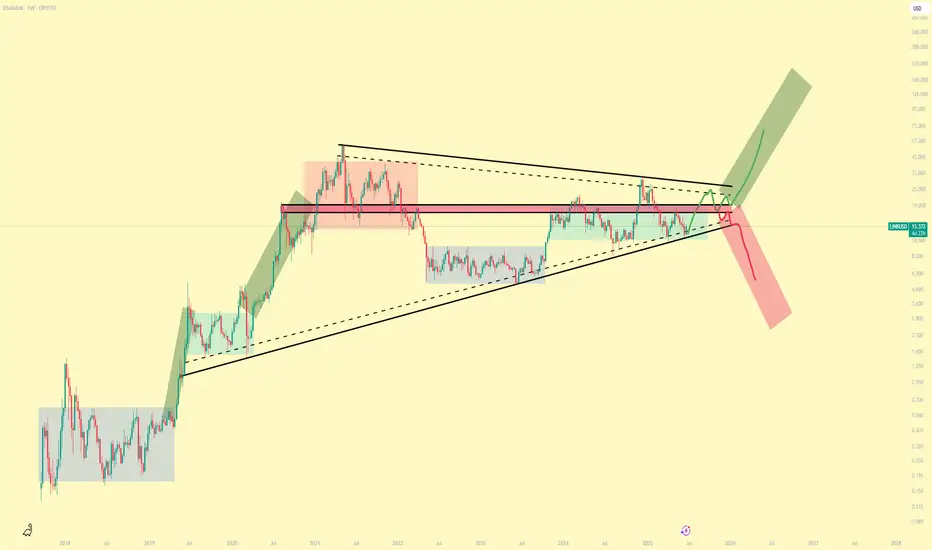
LINKUSD Paths on OfferPretty clear accumulation stages going on and so I am inclined to think we head towards the Bullish path to ~$100
Bears will want to buy LINK at massive discounts and so perhaps we do see some capitulation before our next mark-up phase.
However, the current Total Market cycle patterns, along with the BTC pairing, almost rule out the possibility of further downside, or at least major downside.
LINK about to explodeI believe link is going to lead a massive Bitcoin leg followed by Eth then altcoins. Link tends to start big pushes for Bitcoin. I have seen this happen every single time Bitcoin finds new all-time-highs. The whales are up to something.
TA Wise:
We have a LOT of room for BBWP expansion.
Stochastic RSI is heating up with room.
We note a contracting wedge, with a rising bottom.

LINKUSD – Bullish Momentum Resumes on Daily ChartLINKUSD – Bullish Momentum Resumes on Daily Chart
Chainlink is showing renewed bullish momentum on the daily chart after rebounding sharply from the $13.58 support zone. The price action has reclaimed the $15.30–15.50 resistance area, signaling potential for a continued upward move. MACD is on the verge of a bullish crossover, while RSI is trending higher above the neutral 50 line, confirming growing strength in buyer momentum.
The structure resembles a breakout from a bullish pennant, with a possible target toward $17.95 if momentum holds. Immediate support lies at $14.80 and $13.90. A daily close above $15.60 on strong volume would confirm the bullish continuation.

Chainlink Wave Analysis – 10 June 2025- Chainlink broke daily down channel
- Likely to rise to resistance level 16.00
Chainlink recently broke the resistance trendline of the daily down channel from the start of May (which encloses the previous minor ABC correction 2).
The breakout of this down channel accelerated the active impulse wave 3, which started earlier from the key support level 13.00.
Chainlink can be expected to rise to the next resistance level 16.00 (top of the minor correction ii from the end of May).

ChainLink LINK gearing up for a move back toward $20CRYPTO:LINKUSD found strong buyers in the $14 - $12 equal legs zone after a three #elliottwave pullback, setting the stage for the next upside push.
Momentum is shifting—are you ready for the breakout?

Chainlink 250%Well, had 5 waves up, and a abc (the C had 5 waves) Went perfect to a fib level.
Long term i still think we could go above 100. But for now easy trade tot the 2.618 fib

LINK Bulls Building Toward a Chain ReactionIf you find this information inspiring/helpful, please consider a boost and follow! Any questions or comments, please leave a comment!
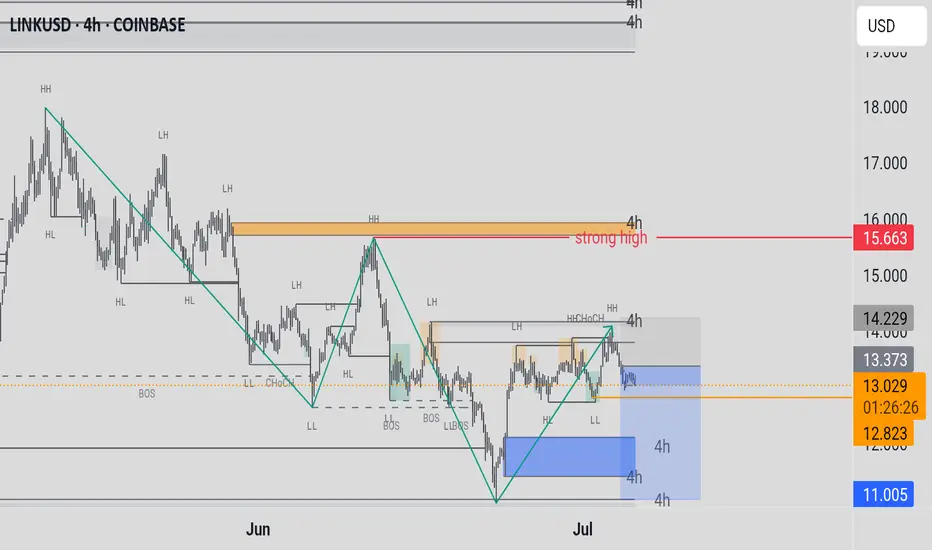
LINK just gave us a clean reaction out of an identified box. Bulls may finally be gaining control and a trend shift up is on the table.
We had eyes on this box for a potential reaction. The market delivered. Now bulls need to prove they can build on it. The first key is to defend 13.284. As long as this level holds, the case for a higher trend remains alive.
Next, bulls need to clear 14.47. That is the first smaller degree LH that must be taken out to confirm that buyers are pushing through the structure.
The big step remains 15.00. This has acted as a major flipping level. A true test for the bulls will be whether they can reclaim and hold above it. If they do, the door opens for stronger upside follow through.
The path is clear:
💥 Hold 13.284
💥 Break 14.47
💥 Reclaim 15.00
We will continue to track this closely with the Elliott Scanner mindset. If momentum picks up through these levels, this could become an attractive higher-degree setup.
Watch these levels carefully. Bulls have work to do, but the ingredients for a shift are building.
Trade Safe!
Trade Clarity!
LINK: Last Buying Opportunity & Stablecoin SuperCycle Part 1Chainlink has printed a weekly bullish hammer after testing the blue fibbonaci retracement support area. This is further evidence that Wave 2 (Green) has bottomed or close to bottoming, and that Wave 3(Green) to the upside is happening soon. A common target for an ABC (White) correction is the 1.618 trend based fib extension at $121.15.
I uploaded a video on Youtube concerning Stablecoin Adoption and Chainlink's Proof of Reserves (POR) role in stablecoin infrastructure that TradingView isn't allowing me to publish.

Weekly trading plan for LINKBINANCE:LINKUSDT has fallen quite low after the upward correction, but in case the local trend turns green, I will consider long positions with the aim to break PP and reach the first resistance level, and then we will see
Locally, a trend line can be drawn and if it is broken, there is a high probability to renew the local bottom and reach the 0.618 Fibonacci level
Important levels and possible price movement are explained in the video
Write a comment with your coins & hit the like button and I will make an analysis for you
The author's opinion may differ from yours,
Consider your risks.
Wish you successful trades ! mura

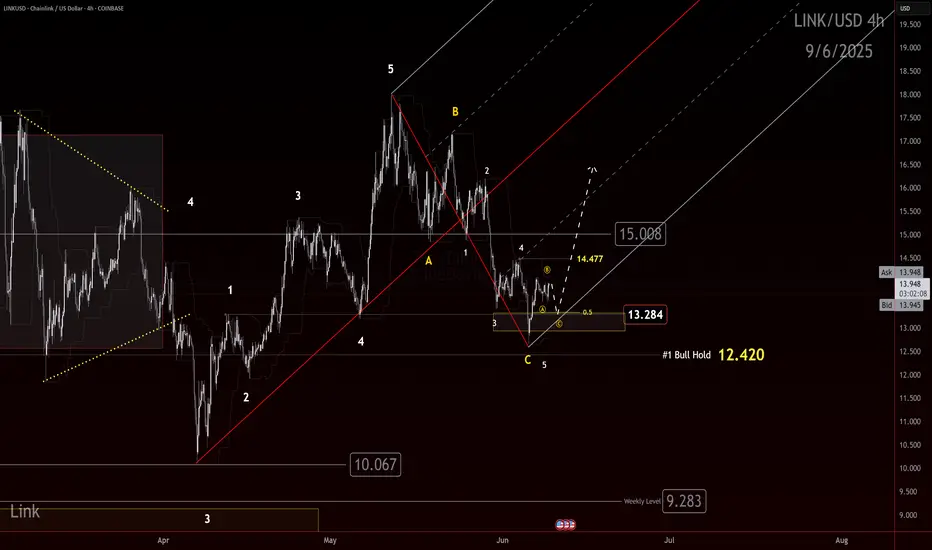
Link Correction complete? CRYPTOCAP:LINK Correction Nearing Completion? Key Levels to Watch
Recap
CRYPTOCAP:LINK continues to retrace and lose levels. Price action looks a bit incomplete on the Elliott wave side, but technicals suggest the retracement may be nearing its end.
The Setup
The cleanest scenario would see price make one more leg down into the 12.42 area. That level offers symmetry and structural balance for a completed correction.
If instead price breaks above 15.008, it opens the door for the correction to be considered complete. Still, confirmation would require a strong reaction from that move—not just a quick wick.
The Outlook
A defense of 12.42 would keep the bullish scenario alive. A break below that level, however, would weaken the outlook and raise the probability of an extended correction or trend continuation lower. Namely an impulsive move down. Right now, we have a potential correction, we need the PA to provide proof of what we have. Wave 4s and 5s at matching degrees as what has printed are need to prove an impulse and an invalidation will prove otherwise.
For now, the focus remains on reactions at these two levels. Watch closely— CRYPTOCAP:LINK could be setting up its next directional move.

