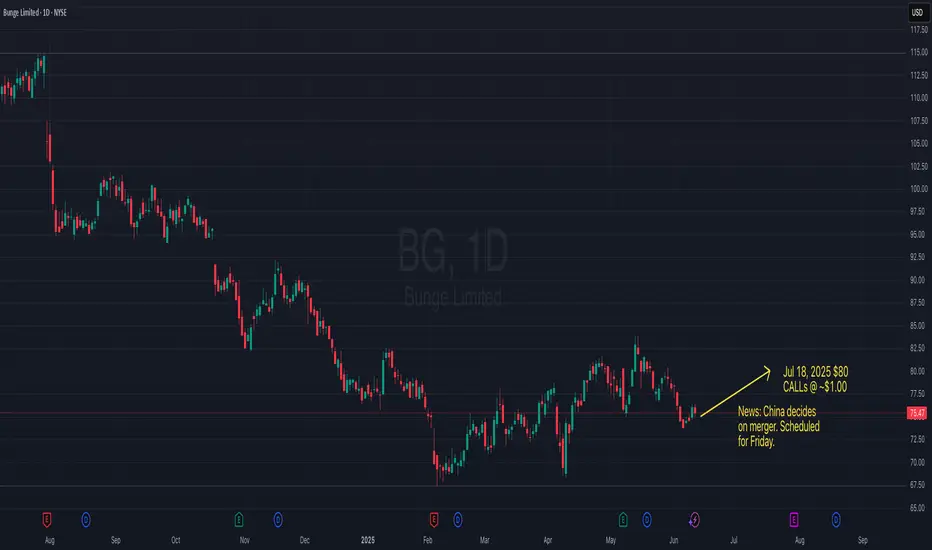
Can BG get at least to $80 on news?BG is undervalued. News from China on Friday to approve merger deal. CALLs are cheap. Can it at least get to $80? Buy the Jul 18, 2025 $80 CALLs. Best scenario is to close it as the price nears the strike, and it depends on what time the news comes out. Good luck.
Next report date
—
Report period
—
EPS estimate
—
Revenue estimate
—
7.98 USD
1.14 B USD
53.11 B USD
132.77 M
About Bunge Limited
Sector
Industry
CEO
Gregory A. Heckman
Website
Headquarters
Chesterfield
Founded
2023
ISIN
CH1300646267
FIGI
BBG01S54C3Z5
Bunge Global SA engages in agribusiness including food and ingredients. It operates through the following segments: Agribusiness, Refined & Specialty Oils, Milling, Sugar & Bioenergy, and Corporate & Other. The Agribusiness segment is an integrated, global business principally involved in the purchase, storage, transportation, processing and sale of agricultural commodities and commodity products. The Refined & Specialty Oils segment includes businesses that sell vegetable oils and fats, including cooking oils, shortenings, specialty ingredients, and renewable diesel feedstocks. The Milling segment refers to the businesses that sell wheat flours, bakery mixes, and corn-based products. The Sugar & Bioenergy segment consists of results from the company’s previously owned 50% ownership interest in BP Bunge Bioenergia. The Corporate & Other segment focuses on the salaries and overhead for corporate functions that are not allocated to individual reporting segments because the operating performance of such reporting segments is evaluated. It connects farmers to consumers to deliver essential and sustainable food, feed and fuel. The company was founded on February 14, 2023 and is headquartered in Chesterfield, MO.
Related stocks
BG - Bunge Limited (Daily chart, NYSE) - Long PositionBG - Bunge Limited (Daily chart, NYSE) - Long Position; short-term research idea.
Risk assessment: Medium {support structure integrity risk}
Risk/Reward ratio ~ 3
Current Market Price (CMP) ~ 75.80
Entry limit ~ 75.50 to 74.50 (Avg. - 75) on April 15, 2025
Target limit ~ 78 (+4%; +3 points)

Trade wars begin.The trade war with Colombia will have a ripple effect across several industries, particularly those heavily reliant on imports and exports. Here’s a breakdown of how this could impact sectors and stocks:
1. Coffee Companies (Starbucks, Green Mountain Coffee)
Impact: Coffee prices are likely to rise

Inverse Head & ShoulderInverse Head & Shoulder is a pattern that could potentially lead to higher prices if it breaks its resistance level. Here there is something that looks like head and two smaller shoulders.

Food Additive Giants: Macro Fib SchematicsThese food additive companies manufacture agricultural ingrediants and additives that nakes its way to prodcust in grocery stores. Archer Daniels Midlands Co, Bunge Limited, International Flavors & Fragrances, Ingredion Inc, DuPont De Nemours, LyondellBasell Industries, Kerry Group, and Givauden are

BGBunge Limited is a global agribusiness and food company.
Soy and sugar prices are still expected to rise.
tp1 114
tp2 119

BGBunge Limited is a global agribusiness and food company.
Soy and sugar prices are expected to rise.
tp1 106
tp2 109

Bearish Alert : BG15 minutes
On top of this bullish wave, a new Bearish alert and bearish crossover with consolidation below the ema.
2/3 of our combo is completed.

Bunge Limited ($BG) LongBunge Limited ( NYSE:BG ) is an American agribusiness and food company, incorporated in Bermuda, and headquartered in St. Louis, Missouri, United States. As well as being an international soybean exporter, it is also involved in food processing, grain trading, and fertilizer. The daily chart shows

BG daily pinnacle pattern wave 4BG daily pinnacle pattern wave 4 don't be greedy ABC correction is to follow

See all ideas
Summarizing what the indicators are suggesting.
Neutral
SellBuy
Strong sellStrong buy
Strong sellSellNeutralBuyStrong buy
Neutral
SellBuy
Strong sellStrong buy
Strong sellSellNeutralBuyStrong buy
Neutral
SellBuy
Strong sellStrong buy
Strong sellSellNeutralBuyStrong buy
An aggregate view of professional's ratings.
Neutral
SellBuy
Strong sellStrong buy
Strong sellSellNeutralBuyStrong buy
Neutral
SellBuy
Strong sellStrong buy
Strong sellSellNeutralBuyStrong buy
Neutral
SellBuy
Strong sellStrong buy
Strong sellSellNeutralBuyStrong buy
Curated watchlists where 0ADJ is featured.


Frequently Asked Questions
The current price of 0ADJ is 83.90 USD — it has decreased by −0.85% in the past 24 hours. Watch 0ADJ stock price performance more closely on the chart.
Depending on the exchange, the stock ticker may vary. For instance, on LSE exchange 0ADJ stocks are traded under the ticker 0ADJ.
0ADJ stock has fallen by −2.82% compared to the previous week, the month change is a 8.98% rise, over the last year 0ADJ has showed a 19.74% increase.
We've gathered analysts' opinions on 0ADJ future price: according to them, 0ADJ price has a max estimate of 105.00 USD and a min estimate of 74.00 USD. Watch 0ADJ chart and read a more detailed 0ADJ stock forecast: see what analysts think of 0ADJ and suggest that you do with its stocks.
0ADJ reached its all-time high on Jun 17, 2025 with the price of 87.22 USD, and its all-time low was 67.48 USD and was reached on Feb 6, 2025. View more price dynamics on 0ADJ chart.
See other stocks reaching their highest and lowest prices.
See other stocks reaching their highest and lowest prices.
0ADJ stock is 1.24% volatile and has beta coefficient of 0.38. Track 0ADJ stock price on the chart and check out the list of the most volatile stocks — is 0ADJ there?
Today 0ADJ has the market capitalization of 11.31 B, it has increased by 5.09% over the last week.
Yes, you can track 0ADJ financials in yearly and quarterly reports right on TradingView.
0ADJ is going to release the next earnings report on Jul 30, 2025. Keep track of upcoming events with our Earnings Calendar.
0ADJ earnings for the last quarter are 1.81 USD per share, whereas the estimation was 1.28 USD resulting in a 41.27% surprise. The estimated earnings for the next quarter are 1.24 USD per share. See more details about 0ADJ earnings.
0ADJ revenue for the last quarter amounts to 11.64 B USD, despite the estimated figure of 13.02 B USD. In the next quarter, revenue is expected to reach 12.64 B USD.
0ADJ net income for the last quarter is 201.00 M USD, while the quarter before that showed 602.00 M USD of net income which accounts for −66.61% change. Track more 0ADJ financial stats to get the full picture.
Yes, 0ADJ dividends are paid quarterly. The last dividend per share was 0.70 USD. As of today, Dividend Yield (TTM)% is 3.26%. Tracking 0ADJ dividends might help you take more informed decisions.
0ADJ dividend yield was 3.50% in 2024, and payout ratio reached 34.02%. The year before the numbers were 2.59% and 17.56% correspondingly. See high-dividend stocks and find more opportunities for your portfolio.
As of Jun 25, 2025, the company has 23 K employees. See our rating of the largest employees — is 0ADJ on this list?
EBITDA measures a company's operating performance, its growth signifies an improvement in the efficiency of a company. 0ADJ EBITDA is 1.85 B USD, and current EBITDA margin is 4.11%. See more stats in 0ADJ financial statements.
Like other stocks, 0ADJ shares are traded on stock exchanges, e.g. Nasdaq, Nyse, Euronext, and the easiest way to buy them is through an online stock broker. To do this, you need to open an account and follow a broker's procedures, then start trading. You can trade 0ADJ stock right from TradingView charts — choose your broker and connect to your account.