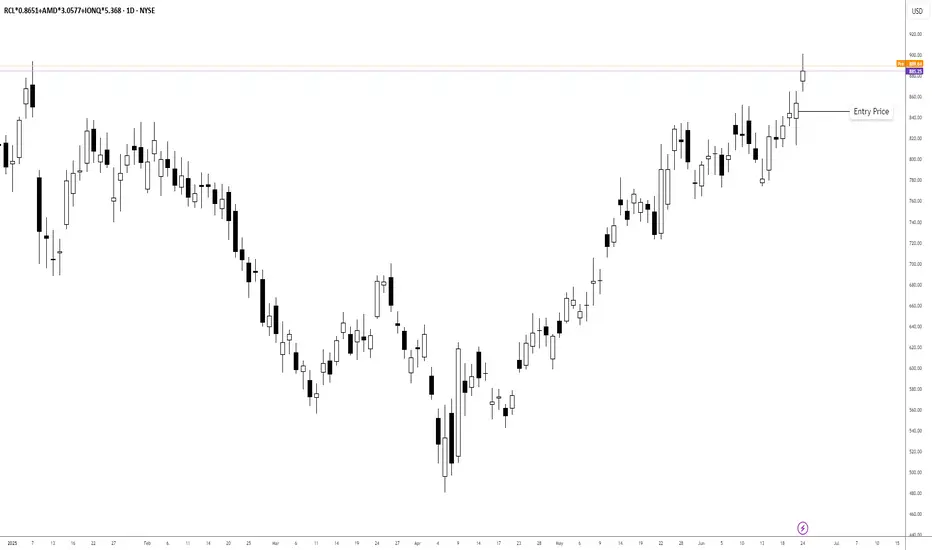
2025/06/24 Portfolio BalanceAdvanced Micro Devices, Inc. (XNAS:AMD):
Current Value: $423.28
Current Price: $138.43 (6.39% daily change)
Quantity: 3.0577
Purchase Date: April 23, 2025
Purchase Price: $129.51
Purchase Value: $396.00
Total Change: 6.89%
Royal Caribbean Cruises Ltd. (XNYS:RCL):
Current Value: $242.63
Current Pric
Key facts today
Next report date
—
Report period
—
EPS estimate
—
Revenue estimate
—
12 USD
2.88 B USD
16.48 B USD
246.86 M
About Royal Caribbean Cruises Ltd.
Sector
Industry
CEO
Jason T. Liberty
Website
Headquarters
Miami
Founded
1968
ISIN
LR0008862868
FIGI
BBG00JRY9521
Royal Caribbean Group is a cruise company, which engages in the ownership and operation of the following global cruise brands: Royal Caribbean International, Celebrity Cruises, and Silversea Cruises. The firm also holds interest in TUI Cruises GmbH, which operates the German brands TUI Cruises and Hapag-Lloyd Cruises. The company was founded by Arne Wilhelmsen in 1968 and is headquartered in Miami, FL.
Related stocks
SHORT $RCL | Recession UnderwayRoyal Caribbean bailout cash drying up.
This chart is a good indication of current economic weakness.
I am looking for NYSE:RCL to drop 60% - 80% from the all time high.
I will continue to monitor and provide updates.
God bless!

A cyclical long idea for a travel cruiseThe main long cyclical idea came after I remembered what happened to cruise companies in the pandemic era that generated a bear market for them, but now I have to say the market has been regaining their up cyclical trend.

RCL Eiffel Tower CAUTION! UPDATERCL is in a very capital-heavy industry that is very economically sensitive.
I first published this Idea back on February 11, 2025. Since then, it has dropped over -40%.
Normally, I would say that from erections come corrections. However, this has the Eiffel Tower structure in place for a full-on

RCL Eiffel Tower CAUTION!RCL is in a very capital-heavy industry that is very economically sensitive.
Normally I would say from erections some corrections. However this has the Eiffel Tower structure in place for a full-on reversal. That remains to be seen. For now, we look for at least a correction and go from there.
Ca

$RCL - Possible trendline retestNYSE:RCL I don’t think the 200-day moving average (DMA) will hold this time. It will have to fall back to the trendline. The question is, will it stop at the first trendline?
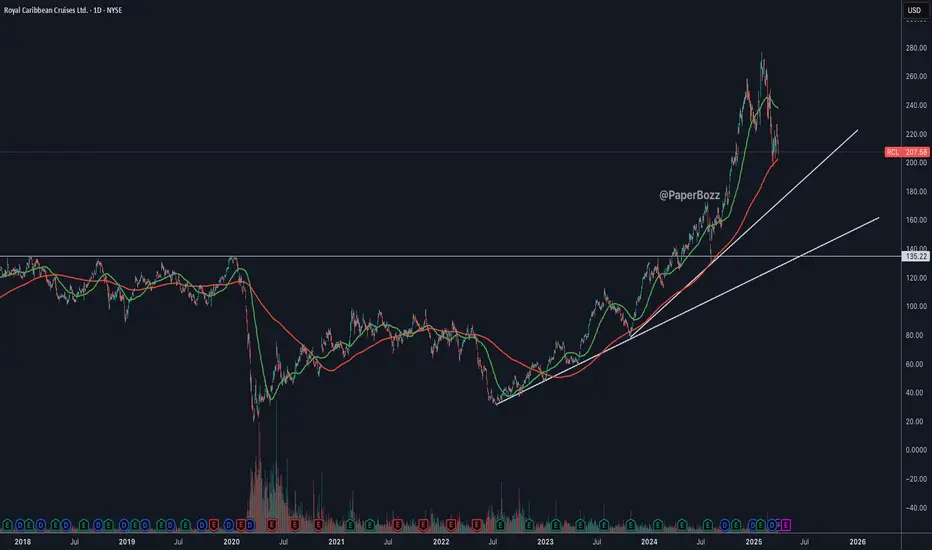
Royal Caribbean Hovers Near GapRoyal Caribbean hit an all-time high four weeks ago, but it’s been sliding since.
The first pattern on today’s chart is the series of lower highs since January 31. Notice how each followed a tepid uptrend that failed to hold. The last may be viewed as a bearish flag within the context of a new shor

$RCL - A Bounce off the Rising Trend LineRCL is exhibiting a bounce off a rising trend line on the daily chart, suggesting a continuation of an uptrend. A rising trend line typically connects higher lows, indicating sustained buying pressure over time. This bounce could signal a resumption of bullish momentum after a pullback to test suppo

RCL BUYRCL Buy set up on the Daily. Nice bounce off the Monthly S1 pivot point and a pullback into Fib buy zone. Nice R/R

Earnings BreakoutI love the earnings season. During earnings season we see great setups that are tradable almost every day.
This is also the case today with RCL . Breakout under enormous volume and high relative strength. NYSE:RCL

See all ideas
Summarizing what the indicators are suggesting.
Neutral
SellBuy
Strong sellStrong buy
Strong sellSellNeutralBuyStrong buy
Neutral
SellBuy
Strong sellStrong buy
Strong sellSellNeutralBuyStrong buy
Neutral
SellBuy
Strong sellStrong buy
Strong sellSellNeutralBuyStrong buy
An aggregate view of professional's ratings.
Neutral
SellBuy
Strong sellStrong buy
Strong sellSellNeutralBuyStrong buy
Neutral
SellBuy
Strong sellStrong buy
Strong sellSellNeutralBuyStrong buy
Neutral
SellBuy
Strong sellStrong buy
Strong sellSellNeutralBuyStrong buy
Displays a symbol's price movements over previous years to identify recurring trends.
RCL5759105
Royal Caribbean Group 6.25% 15-MAR-2032Yield to maturity
6.33%
Maturity date
Mar 15, 2032
USV7780TAP8
ROYAL CARIBB 24/33 REGSYield to maturity
5.71%
Maturity date
Feb 1, 2033
RCL5759106
Royal Caribbean Group 6.25% 15-MAR-2032Yield to maturity
5.59%
Maturity date
Mar 15, 2032
RCL5894476
Royal Caribbean Group 5.625% 30-SEP-2031Yield to maturity
5.41%
Maturity date
Sep 30, 2031
RCL5239261
Royal Caribbean Group 5.5% 31-AUG-2026Yield to maturity
5.27%
Maturity date
Aug 31, 2026
USV7780TAF0
ROYAL CARIBB 21/26 REGSYield to maturity
5.24%
Maturity date
Jul 1, 2026
RC8B
ROYAL CARIBB 21/28 144AYield to maturity
5.24%
Maturity date
Apr 1, 2028
RCL5155641
Royal Caribbean Group 5.5% 01-APR-2028Yield to maturity
5.02%
Maturity date
Apr 1, 2028
RCL5334490
Royal Caribbean Group 5.375% 15-JUL-2027Yield to maturity
4.87%
Maturity date
Jul 15, 2027
US780153AG7
ROYAL CARIB.CR. 2027Yield to maturity
4.79%
Maturity date
Oct 15, 2027
RCL4568009
Royal Caribbean Group 3.7% 15-MAR-2028Yield to maturity
4.74%
Maturity date
Mar 15, 2028
See all 0I1W bonds
Curated watchlists where 0I1W is featured.


Frequently Asked Questions
The current price of 0I1W is 331 USD — it has increased by 3.00% in the past 24 hours. Watch ROYAL CARIBBEAN GROUP COM USD0.01 stock price performance more closely on the chart.
Depending on the exchange, the stock ticker may vary. For instance, on LSE exchange ROYAL CARIBBEAN GROUP COM USD0.01 stocks are traded under the ticker 0I1W.
0I1W stock has risen by 15.83% compared to the previous week, the month change is a 26.32% rise, over the last year ROYAL CARIBBEAN GROUP COM USD0.01 has showed a 111.67% increase.
We've gathered analysts' opinions on ROYAL CARIBBEAN GROUP COM USD0.01 future price: according to them, 0I1W price has a max estimate of 368.00 USD and a min estimate of 230.00 USD. Watch 0I1W chart and read a more detailed ROYAL CARIBBEAN GROUP COM USD0.01 stock forecast: see what analysts think of ROYAL CARIBBEAN GROUP COM USD0.01 and suggest that you do with its stocks.
0I1W reached its all-time high on Jun 27, 2025 with the price of 307 USD, and its all-time low was 24 USD and was reached on Apr 3, 2020. View more price dynamics on 0I1W chart.
See other stocks reaching their highest and lowest prices.
See other stocks reaching their highest and lowest prices.
0I1W stock is 3.66% volatile and has beta coefficient of 1.74. Track ROYAL CARIBBEAN GROUP COM USD0.01 stock price on the chart and check out the list of the most volatile stocks — is ROYAL CARIBBEAN GROUP COM USD0.01 there?
Today ROYAL CARIBBEAN GROUP COM USD0.01 has the market capitalization of 88.56 B, it has increased by 2.90% over the last week.
Yes, you can track ROYAL CARIBBEAN GROUP COM USD0.01 financials in yearly and quarterly reports right on TradingView.
ROYAL CARIBBEAN GROUP COM USD0.01 is going to release the next earnings report on Jul 24, 2025. Keep track of upcoming events with our Earnings Calendar.
0I1W earnings for the last quarter are 2.71 USD per share, whereas the estimation was 2.55 USD resulting in a 6.27% surprise. The estimated earnings for the next quarter are 4.06 USD per share. See more details about ROYAL CARIBBEAN GROUP COM USD0.01 earnings.
ROYAL CARIBBEAN GROUP COM USD0.01 revenue for the last quarter amounts to 4.00 B USD, despite the estimated figure of 4.01 B USD. In the next quarter, revenue is expected to reach 4.54 B USD.
0I1W net income for the last quarter is 730.00 M USD, while the quarter before that showed 553.00 M USD of net income which accounts for 32.01% change. Track more ROYAL CARIBBEAN GROUP COM USD0.01 financial stats to get the full picture.
Yes, 0I1W dividends are paid quarterly. The last dividend per share was 0.75 USD. As of today, Dividend Yield (TTM)% is 0.75%. Tracking ROYAL CARIBBEAN GROUP COM USD0.01 dividends might help you take more informed decisions.
ROYAL CARIBBEAN GROUP COM USD0.01 dividend yield was 0.41% in 2024, and payout ratio reached 8.68%. The year before the numbers were 0.00% and 0.00% correspondingly. See high-dividend stocks and find more opportunities for your portfolio.
As of Jul 3, 2025, the company has 106 K employees. See our rating of the largest employees — is ROYAL CARIBBEAN GROUP COM USD0.01 on this list?
EBITDA measures a company's operating performance, its growth signifies an improvement in the efficiency of a company. ROYAL CARIBBEAN GROUP COM USD0.01 EBITDA is 5.96 B USD, and current EBITDA margin is 34.65%. See more stats in ROYAL CARIBBEAN GROUP COM USD0.01 financial statements.
Like other stocks, 0I1W shares are traded on stock exchanges, e.g. Nasdaq, Nyse, Euronext, and the easiest way to buy them is through an online stock broker. To do this, you need to open an account and follow a broker's procedures, then start trading. You can trade ROYAL CARIBBEAN GROUP COM USD0.01 stock right from TradingView charts — choose your broker and connect to your account.
Investing in stocks requires a comprehensive research: you should carefully study all the available data, e.g. company's financials, related news, and its technical analysis. So ROYAL CARIBBEAN GROUP COM USD0.01 technincal analysis shows the strong buy rating today, and its 1 week rating is strong buy. Since market conditions are prone to changes, it's worth looking a bit further into the future — according to the 1 month rating ROYAL CARIBBEAN GROUP COM USD0.01 stock shows the strong buy signal. See more of ROYAL CARIBBEAN GROUP COM USD0.01 technicals for a more comprehensive analysis.
If you're still not sure, try looking for inspiration in our curated watchlists.
If you're still not sure, try looking for inspiration in our curated watchlists.