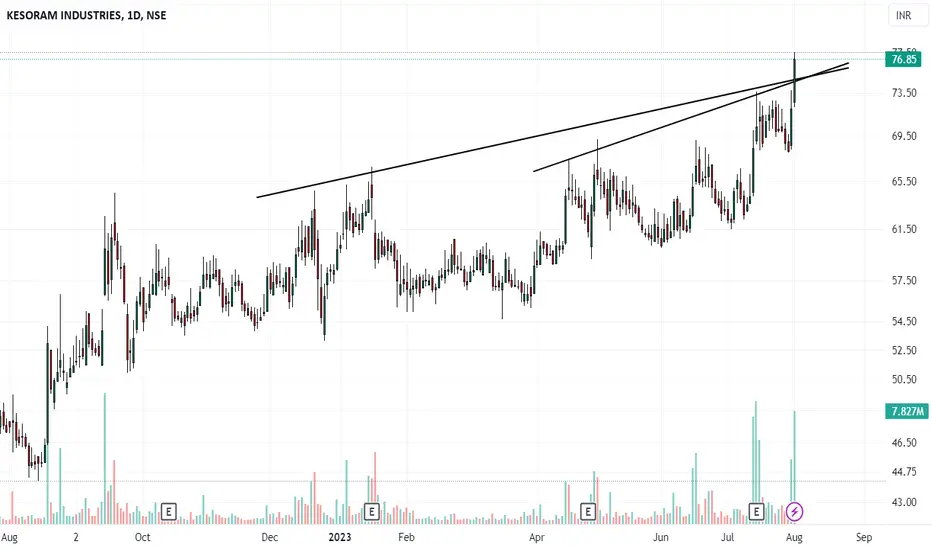
Darvas Box Strategy - Break out Stock - Swing TradeDisclaimer: I am Not SEBI Registered adviser, please take advise from your financial adviser before investing in any stocks. Idea here shared is for education purpose only.
Stock has given break out. Buy above high. Keep this stock in watch list.
Buy above the High and do not forget to keep stop lo
2.07 USD
658.24 M USD
30.61 M USD
About KESORAM INDUSTRIES LTD
Sector
Industry
CEO
Padmalochanan Radhakrishnan
Website
Headquarters
Kolkata
Founded
1919
FIGI
BBG000HV12N1
Kesoram Industries Ltd. engages in the manufacture and sale of cement. The company operates under the India and Others geographical segments. The company was founded on October 18, 1919 and is headquartered in Kolkata, India.

52 Week High Breakout - Positional Trade Disclaimer: I am not a Sebi registered adviser.
This Idea is publish purely for educational purpose only before investing in any stocks please take advise from your financial adviser.
52 Week Breakout. Stock has Crossed 52 week High. Keep in watch list. Buy above the high. Suitable for Positional T

KESORAM INDUSTRIES BRAKEOUT ON DAILY CHARTNSE:KESORAMIND
Kesoram Industries gives brake out at daily chart.
Buy near 190-192
sl 180
Target 212
time duration 1 month

Channel breakout on KESORAMINDKESORAMIND broke out of channel pattern on daily chart. There has been tight consolidation for almost three months. Trading in the range of 10-15%. Also during runup to the channel, there were huge buying as shown in volume. While consolidating you could notice volume has dried up. Signifies sellers

Kesoramind Looking for 200 Big Breakout in Kesoramind verysoon i will be 200 . now moving above the 200 EMA.
also strong fundamental available .

Kesoram Ind - Long ideaI am betting on increased cement demand post monsoon season. Chart pattern is also good, potential to touch 120+ in mid term. Levels are marked on chart. Invest with 6-9 months time horizon.

KESORAM INDUSTRUIES LOOKS GOOD FROM HERENSE:KESORAMIND
KESORAMIND Swing Breakout
R:R (Risk : Reward) = 1:3
TARGET 1 - 114
FINAL TARGET - 130

Trendline BreakoutPlease look into the chart for a detailed understanding.
Consider these for short-term & swing trades with 2% profit.
For BTST trades consider booking
target for 1% - 2%
For long-term trades look out for resistance drawn above closing.
Please consider these ideas for educational purpose
KESORAM TRIANGLE PATTERN swing trade take trade when nifty turns bullish swing trade perfect symmetrical triangle short term opportunity for upside take trade after breakout from the trendline according to own risk this is not call just a analysis.


See all ideas
Summarizing what the indicators are suggesting.
Oscillators
Neutral
SellBuy
Strong sellStrong buy
Strong sellSellNeutralBuyStrong buy
Oscillators
Neutral
SellBuy
Strong sellStrong buy
Strong sellSellNeutralBuyStrong buy
Summary
Neutral
SellBuy
Strong sellStrong buy
Strong sellSellNeutralBuyStrong buy
Summary
Neutral
SellBuy
Strong sellStrong buy
Strong sellSellNeutralBuyStrong buy
Summary
Neutral
SellBuy
Strong sellStrong buy
Strong sellSellNeutralBuyStrong buy
Moving Averages
Neutral
SellBuy
Strong sellStrong buy
Strong sellSellNeutralBuyStrong buy
Moving Averages
Neutral
SellBuy
Strong sellStrong buy
Strong sellSellNeutralBuyStrong buy
Displays a symbol's price movements over previous years to identify recurring trends.