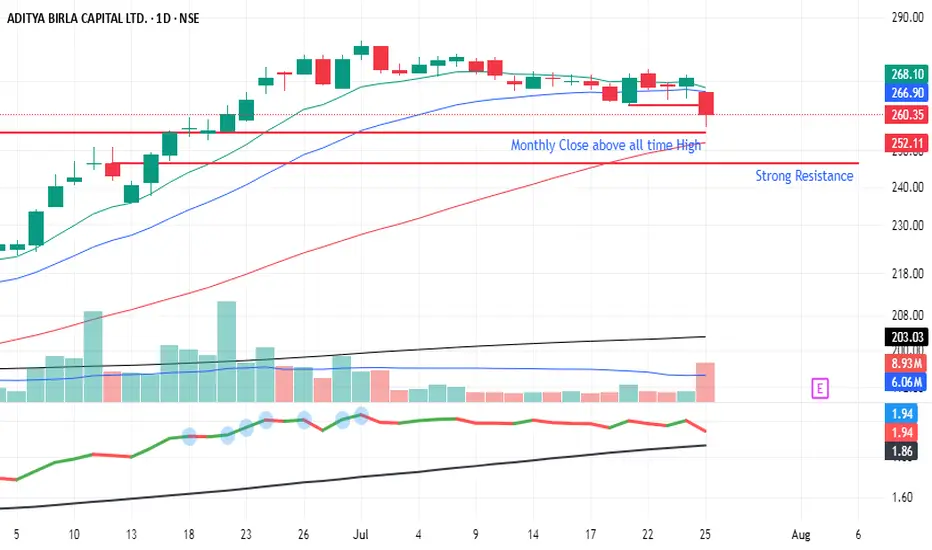
AB Capital - Closed above all time high and consolidationAB Capital
After closing above-time high of Rs. 255 in June 2025, the stock has entered a consolidation phase over the past month.
Key observations:
Support Zone: The 246-255 range is expected to provide strong support.
Trading Plan: Look for buying opportunities near the support zone (246-250) wit
0.16 USD
394.14 M USD
4.86 B USD
About ADITYA BIRLA CAPITAL LTD.
Sector
Industry
CEO
Vishakha Vivek Mulye
Website
Headquarters
Mumbai
Founded
2007
FIGI
BBG00HY9LB89
Aditya Birla Capital Ltd. engages in the provision of financial services. It operates through the following segments: NBFC, Housing Finance, Life Insurance, Asset Management, General Insurance Broking, Stock and Securities Broking, Health Insurance, and Other Financial Services. The company was founded on October 15, 2007 and is headquartered in Mumbai, India.
Related stocks
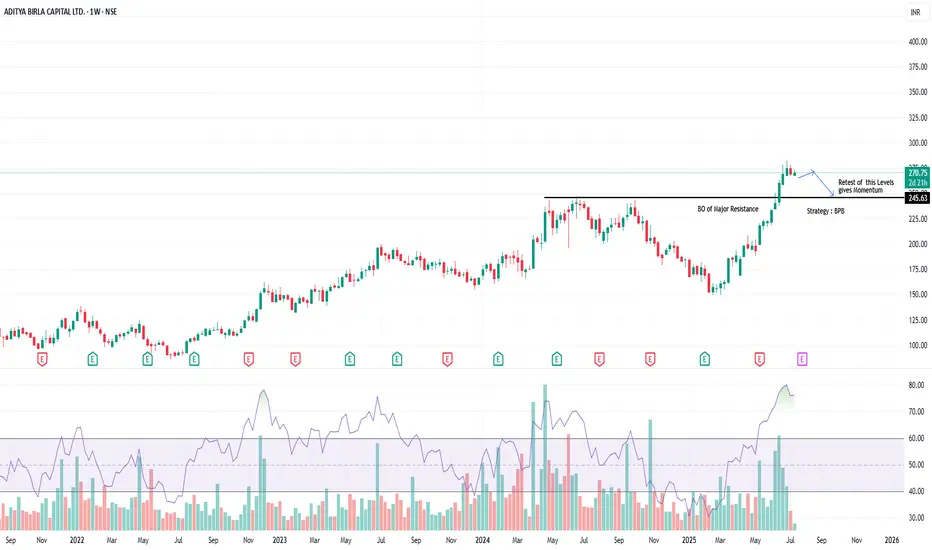
AB Capital – Clean Breakout of Multi-Year Resistance | BPB SetupTimeframe: Weekly | Strategy: Breakout–Pullback (BPB)
Technical Highlights:
========================
✅ BO (Breakout) of a major resistance zone around ₹250–₹255, which was acting as a multi-year supply zone.
📈 Strong bullish momentum seen with expanding volumes and wide-range candles.
🔄 BPB Strateg
Time to pour coffee in the cupBreakout of cup and handle pattern with huge green candles and great volume on monthly timeframe. Breakout in monthly timeframe assures the sustainability post breakout.

Beautiful breakout but not crossed Resistance Beautiful Alma crossover but very close to resistance not broken the resistance may go up tomorrow volume good

Bullish ideaFormed cup and handle at all time high sign can make profits. Make sure to check one more bullish pattern for double confirmation and. Check volume at breakout time. This is only for the educational purposes.

Cup with handle forming or an inverse head and shoulder formingAB Capital has formed either a cup with handle (almost :|) or is trying to make an inverse head shoulder with two shoulders.

ABCAPITALABCAPITAL
watch above levels. green line is our entry, redline is our SL.
DISCLAIMER : I am NOT a SEBI registered advisor or a financial adviser. All the views are for educational purpose only.

ADITYA BIRLA CAPITAL LTD – Trend Reversal Breakout Trade🧠 Technical Highlights:
Downtrend Channel Breakout: Clear breakout from a falling channel pattern
Resistance Break: Strong breakout above supply zone of ₹204–₹210
Volume: Massive volume spike validates bullish strength
RSI: Above 70, indicating strong momentum but not overbought yet
🟢 Buy Setup

Analysis and Summary of the ADITYA BIRLA CAPITAL LTD. (NSE: ABCA🔍 Technical Overview:
Current Price: ₹200.25
Recent Price Action: Price is attempting a bounce after forming a higher low near ₹187.83.
📈 Key Technical Levels:
Fibonacci Levels:
0.0 (Support): ₹187.83
0.5 (Mid-Resistance): ₹204.67
0.618 (Golden Ratio): ₹208.64
1.0 (Previous High): ₹221.51
1.61

aditya birla capitalAditya Birla Capital, a large Indian financial services company, has invested 400 million Indian Rupees (approximately $4.8 million USD) into a company or entity called ABCDL.

See all ideas
Summarizing what the indicators are suggesting.
Oscillators
Neutral
SellBuy
Strong sellStrong buy
Strong sellSellNeutralBuyStrong buy
Oscillators
Neutral
SellBuy
Strong sellStrong buy
Strong sellSellNeutralBuyStrong buy
Summary
Neutral
SellBuy
Strong sellStrong buy
Strong sellSellNeutralBuyStrong buy
Summary
Neutral
SellBuy
Strong sellStrong buy
Strong sellSellNeutralBuyStrong buy
Summary
Neutral
SellBuy
Strong sellStrong buy
Strong sellSellNeutralBuyStrong buy
Moving Averages
Neutral
SellBuy
Strong sellStrong buy
Strong sellSellNeutralBuyStrong buy
Moving Averages
Neutral
SellBuy
Strong sellStrong buy
Strong sellSellNeutralBuyStrong buy
Displays a symbol's price movements over previous years to identify recurring trends.