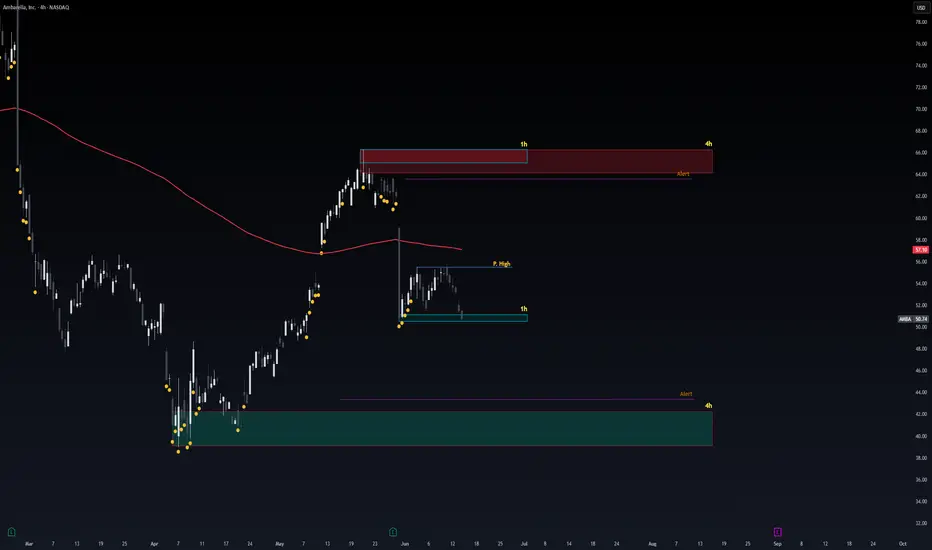
Safe Entry Zone AMBABeautiful Movement price Ranging.
Current price at 1h Green Zone act as Good Support level, But with current situation of news its risky play to get in unless general news changes and calm down.
We Have Out Strongest and the Support level that price will respect is the 4h Green Zone in case the 1h
Next report date
—
Report period
—
EPS estimate
—
Revenue estimate
—
−2.20 EUR
−113.08 M EUR
275.03 M EUR
39.82 M
About Ambarella, Inc.
Sector
Industry
CEO
Feng Ming Wang
Website
Headquarters
Santa Clara
Founded
2004
FIGI
BBG01TNVXFS1
Ambarella, Inc. engages in the development of low-power system-on-a-chip, or SoC, semiconductors and software for edge artificial intelligence, or AI, applications. Its products include video security, advanced driver assistance (ADAS), electronic mirror, drive recorder, driver or cabin monitoring, autonomous driving, and other robotics applications. The firm's geographical segments include Taiwan, Asia Pacific, Europe, North America other than United States and United States. The company was founded by Feng Ming Wang and Leslie D. Kohn on January 15, 2004 and is headquartered in Santa Clara, CA.
Related stocks
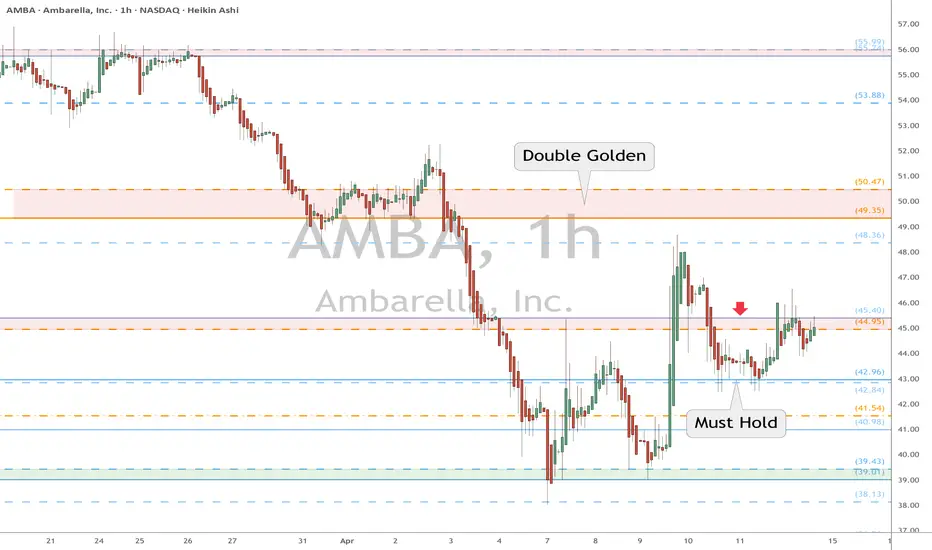
AMBA watch $44.95-45.40: Key resistance to break DownTrendAMBA is struggling with a key resistance at $44.95-45.40.
Break-n-Retest could pop to the major hurdle of $50 round.
Key support for SL shield is the double fib at $42.84-42.96.
AMBA – 30-Min Bearish Trade Setup!📉
🔹 Ticker: AMBA (NASDAQ)
🔹 Setup: Falling Wedge Breakdown + Retest Rejection
🔸 Trigger Zone: ~$40.30 (yellow zone + wedge base retest)
📊 Trade Plan (Short Bias)
✅ Entry Range: $40.20–$40.40
✅ Stop Loss (SL): Above $45.14 (white structure resistance)
✅ Profit Targets:
• TP1: $34.75 (support zone)
•

Looks bullish, eh?See chart. My buy stop limit order gets triggered if the price breaks the last highs. I see the price is getting supported, we've made a higher high and a higher low. So I expect that we reach at least the last high or, more probably, make a new higher high > 65 USD. We'll see.

8/26/24 - $amba - More things that go hrmm @ $508/26/24 :: VROCKSTAR :: NASDAQ:AMBA
More things that go hrmm @ $50
- sales are going in reverse. maybe this changes but idk if it's all that relevant in a ST valuation context. they aren't getting any traction with this product, apparently
- they pay out 3-4x their "FCF" generated in stock comp

AMBA - Aug 24 MATrend Sustainable Momentum- Potential Breakout play 1.25Fib below SR line
- Blue sky drop
- Small cap (RUT)
- Have to close EOD as Friday is non Farm payrolls
MATrend Sustainable Momentum (Systematic) 🚀
This is a variant of the Unsustainable strategy. System identifies stocks (Tech sector) that follows the larger market reg

[Weekly] $AMBA #Ambarella is attractive.NASDAQ:AMBA #Ambarella
is currently testing a significant level. The lower wedge of a 10 years old extended channel . This is the 6th time the band is being tested. Even though testing a wedge several times weakens it. However, below it is almost a technical free fall zone to the 11: 12$

AMBA, long on stage2, Stan Weinstein's Stage Analysis methodThe price is nicely breakout the last LH and 50WMA
With an increase of volume
the RSI is positive and confirmed
with a good divergence.
So I will open long on monday at 58.

AMBA: Potential EntryPrice is currently retesting the previous range which has turned into support. Longer term play would be to hold towards 83 USD with a stop loss somewhere below the previous range.

SYMMETRICAL TRIANGLEThis triangle has broken to the downside.
Oversold on RSI, but securities can remain oversold or overbought for extended periods of time. If you buy using oversold status alone, you will most likely lose money.
No recommendation.

See all ideas
Summarizing what the indicators are suggesting.
Neutral
SellBuy
Strong sellStrong buy
Strong sellSellNeutralBuyStrong buy
Neutral
SellBuy
Strong sellStrong buy
Strong sellSellNeutralBuyStrong buy
Neutral
SellBuy
Strong sellStrong buy
Strong sellSellNeutralBuyStrong buy
An aggregate view of professional's ratings.
Neutral
SellBuy
Strong sellStrong buy
Strong sellSellNeutralBuyStrong buy
Neutral
SellBuy
Strong sellStrong buy
Strong sellSellNeutralBuyStrong buy
Neutral
SellBuy
Strong sellStrong buy
Strong sellSellNeutralBuyStrong buy
Frequently Asked Questions
The current price of 1AMBA is 57.22 EUR — it has decreased by −0.07% in the past 24 hours. Watch AMBARELLA INC stock price performance more closely on the chart.
Depending on the exchange, the stock ticker may vary. For instance, on MIL exchange AMBARELLA INC stocks are traded under the ticker 1AMBA.
1AMBA stock has fallen by −5.08% compared to the previous week, the month change is a 5.57% rise, over the last year AMBARELLA INC has showed a 42.30% increase.
We've gathered analysts' opinions on AMBARELLA INC future price: according to them, 1AMBA price has a max estimate of 80.87 EUR and a min estimate of 53.63 EUR. Watch 1AMBA chart and read a more detailed AMBARELLA INC stock forecast: see what analysts think of AMBARELLA INC and suggest that you do with its stocks.
1AMBA reached its all-time high on Jul 17, 2025 with the price of 60.58 EUR, and its all-time low was 40.22 EUR and was reached on Apr 25, 2025. View more price dynamics on 1AMBA chart.
See other stocks reaching their highest and lowest prices.
See other stocks reaching their highest and lowest prices.
1AMBA stock is 0.07% volatile and has beta coefficient of 2.24. Track AMBARELLA INC stock price on the chart and check out the list of the most volatile stocks — is AMBARELLA INC there?
Today AMBARELLA INC has the market capitalization of 2.43 B, it has increased by 1.00% over the last week.
Yes, you can track AMBARELLA INC financials in yearly and quarterly reports right on TradingView.
AMBARELLA INC is going to release the next earnings report on Sep 2, 2025. Keep track of upcoming events with our Earnings Calendar.
1AMBA earnings for the last quarter are 0.06 EUR per share, whereas the estimation was 0.03 EUR resulting in a 82.61% surprise. The estimated earnings for the next quarter are 0.05 EUR per share. See more details about AMBARELLA INC earnings.
AMBARELLA INC revenue for the last quarter amounts to 75.82 M EUR, despite the estimated figure of 74.17 M EUR. In the next quarter, revenue is expected to reach 76.62 M EUR.
1AMBA net income for the last quarter is −21.48 M EUR, while the quarter before that showed −19.54 M EUR of net income which accounts for −9.96% change. Track more AMBARELLA INC financial stats to get the full picture.
No, 1AMBA doesn't pay any dividends to its shareholders. But don't worry, we've prepared a list of high-dividend stocks for you.
As of Jul 27, 2025, the company has 941 employees. See our rating of the largest employees — is AMBARELLA INC on this list?
EBITDA measures a company's operating performance, its growth signifies an improvement in the efficiency of a company. AMBARELLA INC EBITDA is −75.36 M EUR, and current EBITDA margin is −35.29%. See more stats in AMBARELLA INC financial statements.
Like other stocks, 1AMBA shares are traded on stock exchanges, e.g. Nasdaq, Nyse, Euronext, and the easiest way to buy them is through an online stock broker. To do this, you need to open an account and follow a broker's procedures, then start trading. You can trade AMBARELLA INC stock right from TradingView charts — choose your broker and connect to your account.