Newmont Corp | NEM | Long at $48.00While gold prices have soared recently, gold mining stocks have lagged. Newmont Corp NYSE:NEM , the world's largest gold mining corporation, may be undervalued if the miners take off to catch up to the gold demand/price. Currently sitting near $48.00 and at a historical moving average that it will
Next report date
—
Report period
—
EPS estimate
—
Revenue estimate
—
4.12 EUR
3.17 B EUR
17.93 B EUR
1.11 B
About Newmont Corporation
Sector
Industry
CEO
Thomas Palmer
Website
Headquarters
Denver
Founded
1921
FIGI
BBG01K3W9PH7
Newmont Corp. engages in the exploration and acquisition of gold properties, containing copper, silver, lead, zinc or other metals. It operates through the following geographical segments: Canada, Mexico, Suriname, Argentina, Peru, Australia, Papua New Guinea, Ghana, and U.S. The company was founded by William Boyce Thompson on May 2, 1921 and is headquartered in Denver, CO.
Related stocks

Newmont showing an extremely positive outlookSome notes which can be used as arguments to the bullish outlook:
The stock is above the 200D and even the 200W EMA.
Large inverted head and shoulders structure which presents an opportunity leading up to 80$ which also turns out to be the resistance level tested in 1987 and 2022.
Locally looks

Potential outside week and bullish potential for NEMEntry conditions:
(i) higher share price for ASX:NEM above the level of the potential outside week noted on 13th June (i.e.: above the level of $88.35).
Stop loss for the trade would be:
(i) below the low of the outside week on 11th June (i.e.: below $80.70), should the trade activate.

NEM Newmont Corporation engages in the production and exploration of gold properties. It also explores for copper, silver, zinc, lead, and other metals. average analyst rating $56.
Technically showing cup and handle and above all important MA's. it can run anytime now keep and eye.

Potential Uptrend in NewmontNewmont has been climbing this year, and some traders may see further upside in the S&P 500’s only pure-play gold miner.
The first pattern on today’s chart is the pullback since mid-April. The lower low, lower high and second lower low may be viewed as a potential A-B-C correction. Completion of su

Newmont (NEM): Precious Metals Power Technical SetupNewmont Corporation (NEM), one of the world’s largest gold producers, remains a go-to name for investors seeking exposure to precious metals. With a diverse portfolio of global mining operations, Newmont produces not just gold but also copper, silver, and zinc—making it a key player in both the meta

Newmont (NEM): On the Road to $100?Newmont's recent price action, combined with the strength in gold, is starting to flash a familiar pattern — one that, historically, has preceded major rallies. With gold trading firmly above $2,500/oz and Newmont delivering strong free cash flow ($1.2B in Q1), the fundamental backdrop couldn’t be m

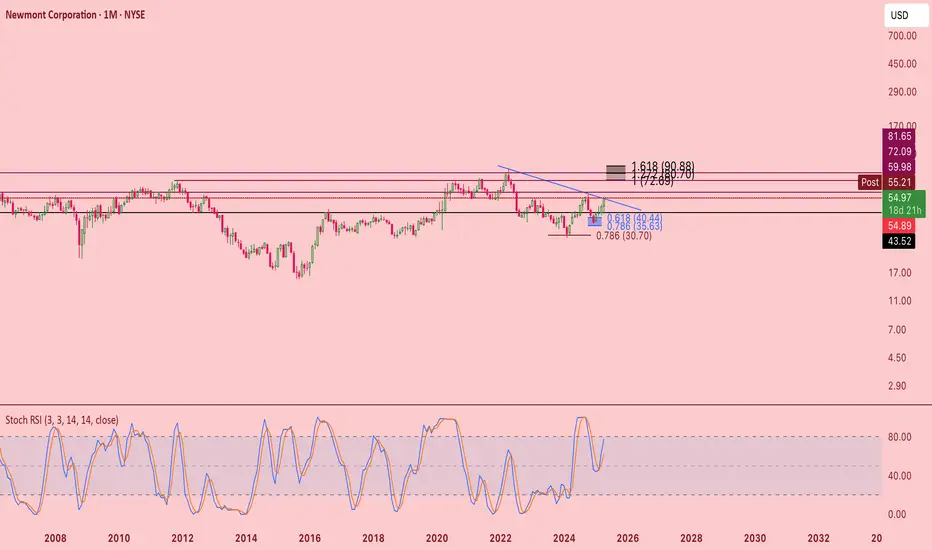
$NEM - looks ready to trendWatch the monthly candle close. If it closes above 55, i expect this one to hit 70 very soon
NEM H&SThis looks like an inverted Head and Shoulders doesn't it?
I wouldn't be surprised if this right shoulder had a double-bottom.

NEM - Big Move AheadOver the long term, I expect to see NEM at 100. My crude wave count shows that we are entering into a wave 3 that can boost shares to mid $80s.

See all ideas
Summarizing what the indicators are suggesting.
Neutral
SellBuy
Strong sellStrong buy
Strong sellSellNeutralBuyStrong buy
Neutral
SellBuy
Strong sellStrong buy
Strong sellSellNeutralBuyStrong buy
Neutral
SellBuy
Strong sellStrong buy
Strong sellSellNeutralBuyStrong buy
An aggregate view of professional's ratings.
Neutral
SellBuy
Strong sellStrong buy
Strong sellSellNeutralBuyStrong buy
Neutral
SellBuy
Strong sellStrong buy
Strong sellSellNeutralBuyStrong buy
Neutral
SellBuy
Strong sellStrong buy
Strong sellSellNeutralBuyStrong buy
Displays a symbol's price movements over previous years to identify recurring trends.
N
NCMG4985652
Newcrest Finance Pty Ltd. 4.2% 13-MAY-2050Yield to maturity
6.57%
Maturity date
May 13, 2050
N
NCMG4985651
Newcrest Finance Pty Ltd. 3.25% 13-MAY-2030Yield to maturity
6.18%
Maturity date
May 13, 2030
See all 1NEM bonds
Curated watchlists where 1NEM is featured.


Frequently Asked Questions
The current price of 1NEM is 51.24 EUR — it has increased by 1.93% in the past 24 hours. Watch NEWMONT stock price performance more closely on the chart.
Depending on the exchange, the stock ticker may vary. For instance, on MIL exchange NEWMONT stocks are traded under the ticker 1NEM.
1NEM stock has risen by 2.89% compared to the previous week, the month change is a 9.92% rise, over the last year NEWMONT has showed a 31.08% increase.
We've gathered analysts' opinions on NEWMONT future price: according to them, 1NEM price has a max estimate of 78.58 EUR and a min estimate of 48.72 EUR. Watch 1NEM chart and read a more detailed NEWMONT stock forecast: see what analysts think of NEWMONT and suggest that you do with its stocks.
1NEM reached its all-time high on Oct 23, 2024 with the price of 54.40 EUR, and its all-time low was 27.52 EUR and was reached on Feb 28, 2024. View more price dynamics on 1NEM chart.
See other stocks reaching their highest and lowest prices.
See other stocks reaching their highest and lowest prices.
1NEM stock is 1.89% volatile and has beta coefficient of 0.83. Track NEWMONT stock price on the chart and check out the list of the most volatile stocks — is NEWMONT there?
Today NEWMONT has the market capitalization of 56.39 B, it has increased by 1.06% over the last week.
Yes, you can track NEWMONT financials in yearly and quarterly reports right on TradingView.
NEWMONT is going to release the next earnings report on Jul 17, 2025. Keep track of upcoming events with our Earnings Calendar.
1NEM earnings for the last quarter are 1.16 EUR per share, whereas the estimation was 0.85 EUR resulting in a 36.51% surprise. The estimated earnings for the next quarter are 0.87 EUR per share. See more details about NEWMONT earnings.
NEWMONT revenue for the last quarter amounts to 4.63 B EUR, despite the estimated figure of 4.35 B EUR. In the next quarter, revenue is expected to reach 4.14 B EUR.
1NEM net income for the last quarter is 1.75 B EUR, while the quarter before that showed 1.36 B EUR of net income which accounts for 28.97% change. Track more NEWMONT financial stats to get the full picture.
Yes, 1NEM dividends are paid quarterly. The last dividend per share was 0.22 EUR. As of today, Dividend Yield (TTM)% is 1.72%. Tracking NEWMONT dividends might help you take more informed decisions.
As of Jun 22, 2025, the company has 42.6 K employees. See our rating of the largest employees — is NEWMONT on this list?
EBITDA measures a company's operating performance, its growth signifies an improvement in the efficiency of a company. NEWMONT EBITDA is 8.84 B EUR, and current EBITDA margin is 46.62%. See more stats in NEWMONT financial statements.
Like other stocks, 1NEM shares are traded on stock exchanges, e.g. Nasdaq, Nyse, Euronext, and the easiest way to buy them is through an online stock broker. To do this, you need to open an account and follow a broker's procedures, then start trading. You can trade NEWMONT stock right from TradingView charts — choose your broker and connect to your account.
Investing in stocks requires a comprehensive research: you should carefully study all the available data, e.g. company's financials, related news, and its technical analysis. So NEWMONT technincal analysis shows the buy rating today, and its 1 week rating is buy. Since market conditions are prone to changes, it's worth looking a bit further into the future — according to the 1 month rating NEWMONT stock shows the strong buy signal. See more of NEWMONT technicals for a more comprehensive analysis.
If you're still not sure, try looking for inspiration in our curated watchlists.
If you're still not sure, try looking for inspiration in our curated watchlists.