LBALUM 200-Day SMA Buy SignalsObservation
1. The price action breaks the 200-day SMA upwards (Bullish Breakouts).
2. The price bounce on the 200-day SMA two times (Support Bounce).
Forecast
1. Price might drop to bounce again for the third time or bearish breakout on the 200-day SMA.
2. Price might go for a long uptrend
Remi
0.090 MYR
29.26 M MYR
955.52 M MYR
411.41 M
About LB ALUMINIUM BHD
Sector
Industry
CEO
Kong Wing
Website
Headquarters
Beranang
Founded
1985
ISIN
MYL9326OO009
FIGI
BBG000C4H384
LB Aluminium Bhd. engages in the business of manufacturing, marketing, and trading aluminium extrusions and other metal products. It operates under the Aluminium and Property Development segments. The Aluminium segment focuses on aluminium and other metal products; ancillary businesses of property holding; providing performance tests for windows, doors, and facades; metal stamping; and other engineering works. The Property Development segment is involved in Vistarena Development Sdn Bhd, Pembinaan Serta Hebat Sdn Bhd, and Contras Build Sdn Bhd. The company was founded on April 16, 1985 and is headquartered in Beranang, Malaysia.

LBALUM VOLATILITY CHANGE in EW ABC COREECTIVE ZONELBALUM spotted with volatility reversal at Elliott Waves' ABC corrective zone.

VCP SETUP LBALUMFair fundamental company.Price just break above the horizontal line with high volume.

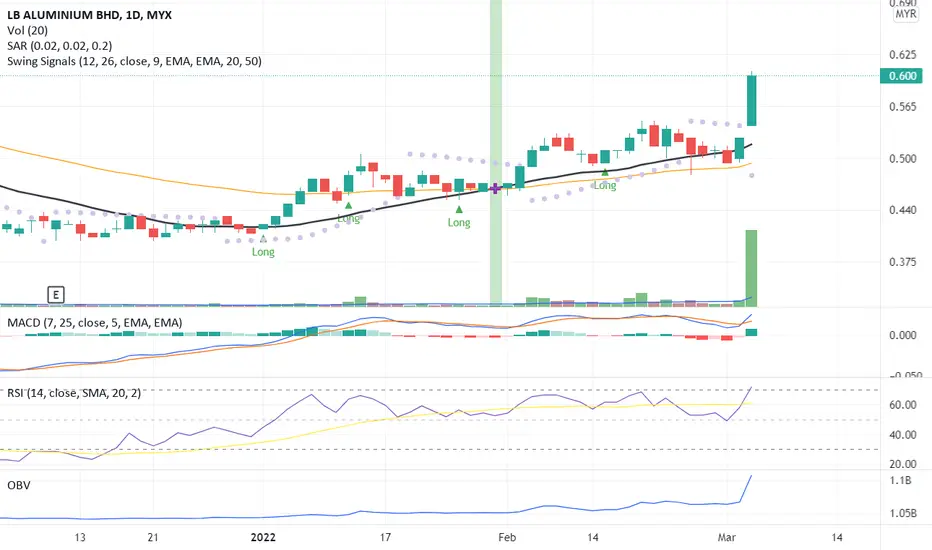
A Breakout Signal!Significant price movement together with high volume indicates the candlestick pattern in a breakout phase.
The RSI indicator confirmed the price breakout due to gains is greater than the losses where the momentum indexes >70.
MACD and OBV indicators also confirmed the price trend; a strong uptren
LBALUM belum ada dynamicThe chart shown potential TP and potential retracement for support.
All will be depends on market sentiment and company dynamic itself.
TAYOR.

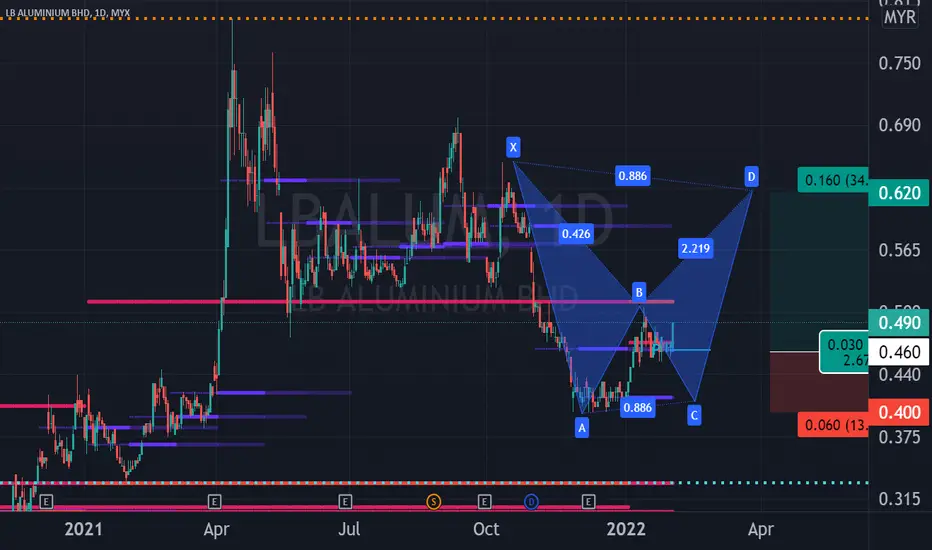
LBALUM ON ELLIOTT'S AND HARMONIC LBALUM rebounded from 0.400 as per Elliott Waves' Theory on ABC Corrective Zone on expanded flat. It is also on Bat Harmonic Pattern where the price stabilised at fibo618 of Elliott's Wave 1 to Wave 5 waves. At present, the price has crossed the daily pivot point and is heading to 0.500 yearly pivot
LBALUM TECHNICAL ANALYSISTechnical analysis for LBALUM Stock based on Trend Analysis, Chart Pattern and Fibonacci Retracement
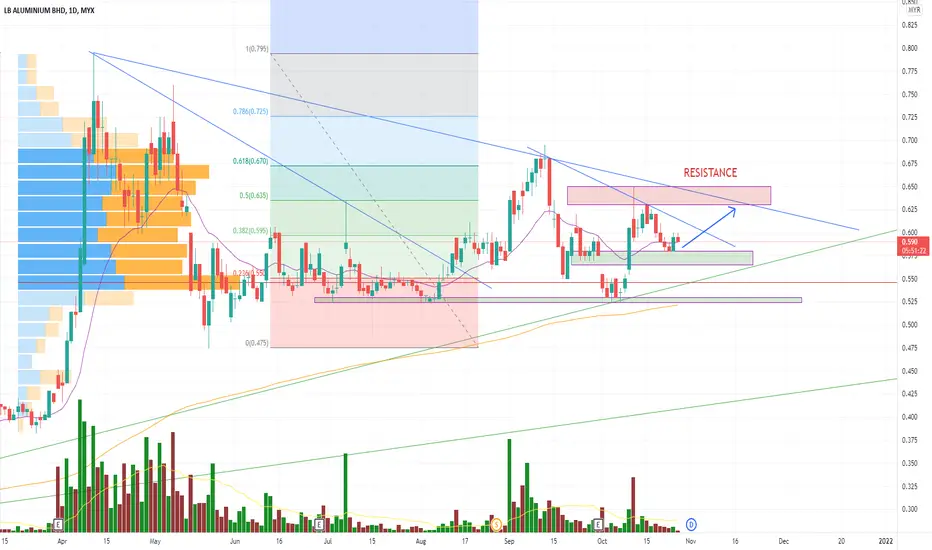
Growing Stock - upside breakoutLBALUM rose above bullish triangle continuation pattern and tested Fibonacci resistance at 0.69 with a pullback. We see a possibility of technical rebound to the upside at current support level 0.605 as the price is currently trading at resistance turns support level coincides with 61.8% Fibonacci r

LBALUM - Try to break the BOX?Trendband area to begin with breakout candle. Possible to EP at purple box. Close monitor High and Low since Doji candle appears.

LBAlum Trend Analysisdisclaimer : this is purely for learning purpose on trend analysis using published indicators, namely, Chips Master, Trend Master, MCDX Plus.
No recommendation of buy/sell
Lbalum completed chips accumulation, first up and second up. Currently, retrace sideways.
Chips Master is used mainly for chips

See all ideas
Summarizing what the indicators are suggesting.
Oscillators
Neutral
SellBuy
Strong sellStrong buy
Strong sellSellNeutralBuyStrong buy
Oscillators
Neutral
SellBuy
Strong sellStrong buy
Strong sellSellNeutralBuyStrong buy
Summary
Neutral
SellBuy
Strong sellStrong buy
Strong sellSellNeutralBuyStrong buy
Summary
Neutral
SellBuy
Strong sellStrong buy
Strong sellSellNeutralBuyStrong buy
Summary
Neutral
SellBuy
Strong sellStrong buy
Strong sellSellNeutralBuyStrong buy
Moving Averages
Neutral
SellBuy
Strong sellStrong buy
Strong sellSellNeutralBuyStrong buy
Moving Averages
Neutral
SellBuy
Strong sellStrong buy
Strong sellSellNeutralBuyStrong buy
Displays a symbol's price movements over previous years to identify recurring trends.
Related stocks
Frequently Asked Questions
The current price of LBALUM is 0.470 MYR — it hasn't changed in the past 24 hours. Watch LB ALUMINIUM BHD stock price performance more closely on the chart.
Depending on the exchange, the stock ticker may vary. For instance, on MYX exchange LB ALUMINIUM BHD stocks are traded under the ticker LBALUM.
LBALUM stock hasn't changed in a week, the month change is a −1.05% fall, over the last year LB ALUMINIUM BHD has showed a −9.62% decrease.
LBALUM reached its all-time high on Apr 12, 2021 with the price of 0.795 MYR, and its all-time low was 0.055 MYR and was reached on Aug 21, 2006. View more price dynamics on LBALUM chart.
See other stocks reaching their highest and lowest prices.
See other stocks reaching their highest and lowest prices.
LBALUM stock is 2.17% volatile and has beta coefficient of 1.02. Track LB ALUMINIUM BHD stock price on the chart and check out the list of the most volatile stocks — is LB ALUMINIUM BHD there?
Today LB ALUMINIUM BHD has the market capitalization of 204.38 M, it has increased by 1.06% over the last week.
Yes, you can track LB ALUMINIUM BHD financials in yearly and quarterly reports right on TradingView.
LBALUM net income for the last quarter is 12.63 M MYR, while the quarter before that showed 7.64 M MYR of net income which accounts for 65.32% change. Track more LB ALUMINIUM BHD financial stats to get the full picture.
Yes, LBALUM dividends are paid annually. The last dividend per share was 0.03 MYR. As of today, Dividend Yield (TTM)% is 5.32%. Tracking LB ALUMINIUM BHD dividends might help you take more informed decisions.
LB ALUMINIUM BHD dividend yield was 4.85% in 2023, and payout ratio reached 37.15%. The year before the numbers were 5.21% and 28.06% correspondingly. See high-dividend stocks and find more opportunities for your portfolio.
As of Jun 19, 2025, the company has 982 employees. See our rating of the largest employees — is LB ALUMINIUM BHD on this list?
EBITDA measures a company's operating performance, its growth signifies an improvement in the efficiency of a company. LB ALUMINIUM BHD EBITDA is 111.47 M MYR, and current EBITDA margin is 7.74%. See more stats in LB ALUMINIUM BHD financial statements.
Like other stocks, LBALUM shares are traded on stock exchanges, e.g. Nasdaq, Nyse, Euronext, and the easiest way to buy them is through an online stock broker. To do this, you need to open an account and follow a broker's procedures, then start trading. You can trade LB ALUMINIUM BHD stock right from TradingView charts — choose your broker and connect to your account.
Investing in stocks requires a comprehensive research: you should carefully study all the available data, e.g. company's financials, related news, and its technical analysis. So LB ALUMINIUM BHD technincal analysis shows the strong sell today, and its 1 week rating is sell. Since market conditions are prone to changes, it's worth looking a bit further into the future — according to the 1 month rating LB ALUMINIUM BHD stock shows the sell signal. See more of LB ALUMINIUM BHD technicals for a more comprehensive analysis.
If you're still not sure, try looking for inspiration in our curated watchlists.
If you're still not sure, try looking for inspiration in our curated watchlists.