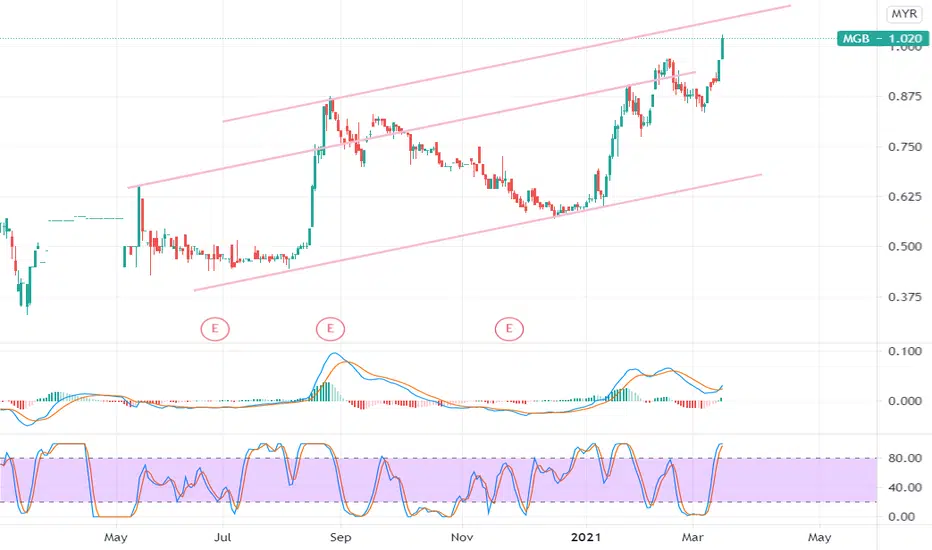
MGB - Analysis on price movementY wave projection. To achieved target (E) at Fibo line 0.886-1, the price must breakout 52w High within stipulated time.
N wave with 3N target for the nearest target at this moment.
Tenkan Sen & Kijun Sen as nearest support and resistance. Price needs to cross above the Kumo to reach all the targ
Next report date
—
Report period
—
EPS estimate
—
Revenue estimate
—
0.100 MYR
60.34 M MYR
1.03 B MYR
162.63 M
About MGB BERHAD
Sector
Industry
CEO
Lit Chek Lim
Website
Headquarters
Petaling Jaya
Founded
1997
ISIN
MYL7595OO001
FIGI
BBG000HL4JD4
MGB Bhd. engages in constructing, designing, and building projects for general construction and infrastructure works. It operates through the following divisions: Construction and Trading, Property Development, and Others. The Construction and Trading division includes industrialized building system, geotechnical specialization, value engineering, and project management services. The Property Development division develops residential and commercial properties. The Others division covers the investment holding, provision of management services, and hospitality. The company was founded in December 1997 and is headquartered in Petaling Jaya, Malaysia.

MGB might dong Pull backAs per Stochastic , MGB is in OB region. but the MACD just crossed. So possible another price movement for 1-2 days, before it going pullback.
Hit TP1, remains Bullish for TP2MGB has recently closed above resistance level at 0.93 this week, our view remains bullish for the next movement to Fibonacci level 2.618 at 1.17. New support is at 0.775 marked as S1. Other technical markings are still intact.
Link:
Disclaimer: Our content is intended to be used and must be used

Bullish BreakoutMGB surged higher above two-years downtrend line to Fibonacci 1.618, closed above resistance at 0.815. The share was then retraced to current nearest support at Fibonacci sell target 1.618 coincide 200-days SMA and made significant breakout above the downtrend channel. Our price target is at 1.17, h


See all ideas
Summarizing what the indicators are suggesting.
Neutral
SellBuy
Strong sellStrong buy
Strong sellSellNeutralBuyStrong buy
Neutral
SellBuy
Strong sellStrong buy
Strong sellSellNeutralBuyStrong buy
Neutral
SellBuy
Strong sellStrong buy
Strong sellSellNeutralBuyStrong buy
An aggregate view of professional's ratings.
Neutral
SellBuy
Strong sellStrong buy
Strong sellSellNeutralBuyStrong buy
Neutral
SellBuy
Strong sellStrong buy
Strong sellSellNeutralBuyStrong buy
Neutral
SellBuy
Strong sellStrong buy
Strong sellSellNeutralBuyStrong buy
Displays a symbol's price movements over previous years to identify recurring trends.
Related stocks
Frequently Asked Questions
The current price of MGB is 0.585 MYR — it has decreased by −1.68% in the past 24 hours. Watch MGB BERHAD stock price performance more closely on the chart.
Depending on the exchange, the stock ticker may vary. For instance, on MYX exchange MGB BERHAD stocks are traded under the ticker MGB.
MGB stock has fallen by −4.10% compared to the previous week, the month change is a −5.65% fall, over the last year MGB BERHAD has showed a −33.90% decrease.
We've gathered analysts' opinions on MGB BERHAD future price: according to them, MGB price has a max estimate of 1.09 MYR and a min estimate of 1.00 MYR. Watch MGB chart and read a more detailed MGB BERHAD stock forecast: see what analysts think of MGB BERHAD and suggest that you do with its stocks.
MGB stock is 3.42% volatile and has beta coefficient of 0.89. Track MGB BERHAD stock price on the chart and check out the list of the most volatile stocks — is MGB BERHAD there?
Today MGB BERHAD has the market capitalization of 352.03 M, it has decreased by −2.42% over the last week.
Yes, you can track MGB BERHAD financials in yearly and quarterly reports right on TradingView.
MGB BERHAD is going to release the next earnings report on Aug 20, 2025. Keep track of upcoming events with our Earnings Calendar.
MGB net income for the last quarter is 11.88 M MYR, while the quarter before that showed 14.44 M MYR of net income which accounts for −17.74% change. Track more MGB BERHAD financial stats to get the full picture.
MGB BERHAD dividend yield was 4.19% in 2024, and payout ratio reached 30.00%. The year before the numbers were 2.44% and 20.06% correspondingly. See high-dividend stocks and find more opportunities for your portfolio.
As of Jun 14, 2025, the company has 512 employees. See our rating of the largest employees — is MGB BERHAD on this list?
EBITDA measures a company's operating performance, its growth signifies an improvement in the efficiency of a company. MGB BERHAD EBITDA is 97.70 M MYR, and current EBITDA margin is 10.93%. See more stats in MGB BERHAD financial statements.
Like other stocks, MGB shares are traded on stock exchanges, e.g. Nasdaq, Nyse, Euronext, and the easiest way to buy them is through an online stock broker. To do this, you need to open an account and follow a broker's procedures, then start trading. You can trade MGB BERHAD stock right from TradingView charts — choose your broker and connect to your account.
Investing in stocks requires a comprehensive research: you should carefully study all the available data, e.g. company's financials, related news, and its technical analysis. So MGB BERHAD technincal analysis shows the strong sell today, and its 1 week rating is sell. Since market conditions are prone to changes, it's worth looking a bit further into the future — according to the 1 month rating MGB BERHAD stock shows the sell signal. See more of MGB BERHAD technicals for a more comprehensive analysis.
If you're still not sure, try looking for inspiration in our curated watchlists.
If you're still not sure, try looking for inspiration in our curated watchlists.