we need to wait and see on this oneCTRN breaking all support areas! very dangerous to add a long position here, better to wait for confirmation move.
above 36.71 id go long, below 23.29 id short
Next report date
—
Report period
—
EPS estimate
—
Revenue estimate
—
−4.66 USD
−43.17 M USD
753.08 M USD
7.26 M
About Citi Trends, Inc.
Sector
Industry
CEO
Kenneth Duane Seipel
Website
Headquarters
Savannah
Founded
1946
FIGI
BBG000BRLWY6
Citi Trends, Inc. engages in the retail of urban fashion apparel, accessories, and home trends. It offers products under its Citi Steps and Red Ape brands. The company was founded in 1946 and is headquartered in Savannah, GA.
Related stocks

I'm long today here.I bought today on holding the holder. There is a good chance of a rebound. SL only break down Fib support. Long, to the moon :-)

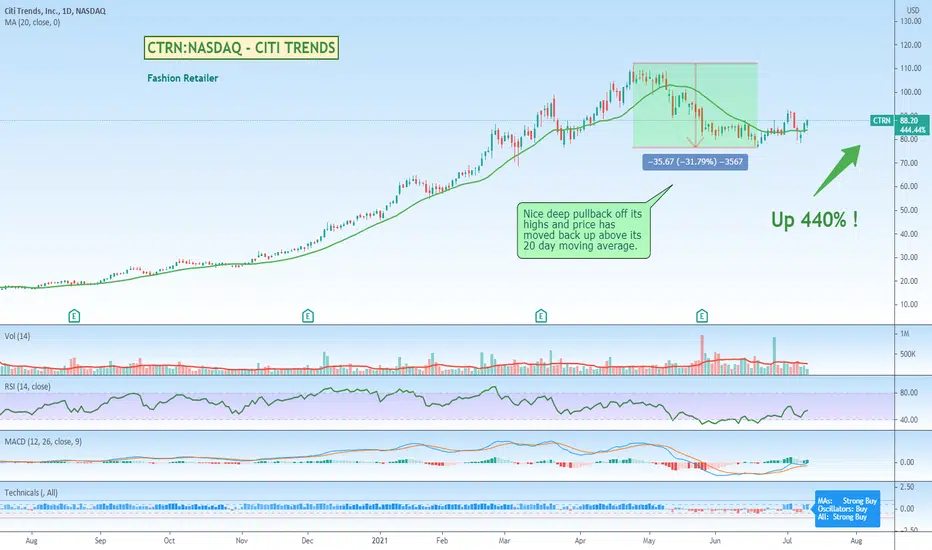
Citi Trends Trending The Right WayCity Trends is a large fashion retailer with over 570+ stores in 33 states in the US. Stock has had a pretty deep pullback and looks to be recovering nicely. It back up above its 20 day moving average and hopefully will continue its stellar run. Could be worth keeping at eye on if you like the idea

CRTN: Ascending triangle. Waiting for confirmationAscending Triangle, waiting confirmation
Pros:
Descending volume during formation
Volume on break out
R/R ratio avove 5
PPS above 50MA and 200MA
RS ascending and above 0
250RSI above 50
Cons:
200MA flat
If confirmed:
PT1=22,69 (filled)
PT2=27,40


See all ideas
Summarizing what the indicators are suggesting.
Neutral
SellBuy
Strong sellStrong buy
Strong sellSellNeutralBuyStrong buy
Neutral
SellBuy
Strong sellStrong buy
Strong sellSellNeutralBuyStrong buy
Neutral
SellBuy
Strong sellStrong buy
Strong sellSellNeutralBuyStrong buy
An aggregate view of professional's ratings.
Neutral
SellBuy
Strong sellStrong buy
Strong sellSellNeutralBuyStrong buy
Neutral
SellBuy
Strong sellStrong buy
Strong sellSellNeutralBuyStrong buy
Neutral
SellBuy
Strong sellStrong buy
Strong sellSellNeutralBuyStrong buy
Displays a symbol's price movements over previous years to identify recurring trends.
Frequently Asked Questions
The current price of CTRN is 31.16 USD — it has decreased by −1.96% in the past 24 hours. Watch Citi Trends, Inc. stock price performance more closely on the chart.
Depending on the exchange, the stock ticker may vary. For instance, on NASDAQ exchange Citi Trends, Inc. stocks are traded under the ticker CTRN.
CTRN stock has risen by 4.88% compared to the previous week, the month change is a 1.98% rise, over the last year Citi Trends, Inc. has showed a 88.28% increase.
We've gathered analysts' opinions on Citi Trends, Inc. future price: according to them, CTRN price has a max estimate of 40.00 USD and a min estimate of 37.00 USD. Watch CTRN chart and read a more detailed Citi Trends, Inc. stock forecast: see what analysts think of Citi Trends, Inc. and suggest that you do with its stocks.
CTRN reached its all-time high on Apr 26, 2021 with the price of 111.44 USD, and its all-time low was 6.70 USD and was reached on Apr 3, 2020. View more price dynamics on CTRN chart.
See other stocks reaching their highest and lowest prices.
See other stocks reaching their highest and lowest prices.
CTRN stock is 2.30% volatile and has beta coefficient of 1.85. Track Citi Trends, Inc. stock price on the chart and check out the list of the most volatile stocks — is Citi Trends, Inc. there?
Today Citi Trends, Inc. has the market capitalization of 258.44 M, it has increased by 4.78% over the last week.
Yes, you can track Citi Trends, Inc. financials in yearly and quarterly reports right on TradingView.
Citi Trends, Inc. is going to release the next earnings report on Aug 26, 2025. Keep track of upcoming events with our Earnings Calendar.
CTRN earnings for the last quarter are 0.17 USD per share, whereas the estimation was −0.20 USD resulting in a 187.18% surprise. The estimated earnings for the next quarter are −1.01 USD per share. See more details about Citi Trends, Inc. earnings.
Citi Trends, Inc. revenue for the last quarter amounts to 201.73 M USD, despite the estimated figure of 195.74 M USD. In the next quarter, revenue is expected to reach 188.18 M USD.
CTRN net income for the last quarter is 871.00 K USD, while the quarter before that showed −14.18 M USD of net income which accounts for 106.14% change. Track more Citi Trends, Inc. financial stats to get the full picture.
As of Aug 12, 2025, the company has 2.6 K employees. See our rating of the largest employees — is Citi Trends, Inc. on this list?
EBITDA measures a company's operating performance, its growth signifies an improvement in the efficiency of a company. Citi Trends, Inc. EBITDA is −11.03 M USD, and current EBITDA margin is −2.41%. See more stats in Citi Trends, Inc. financial statements.
Like other stocks, CTRN shares are traded on stock exchanges, e.g. Nasdaq, Nyse, Euronext, and the easiest way to buy them is through an online stock broker. To do this, you need to open an account and follow a broker's procedures, then start trading. You can trade Citi Trends, Inc. stock right from TradingView charts — choose your broker and connect to your account.
Investing in stocks requires a comprehensive research: you should carefully study all the available data, e.g. company's financials, related news, and its technical analysis. So Citi Trends, Inc. technincal analysis shows the buy rating today, and its 1 week rating is strong buy. Since market conditions are prone to changes, it's worth looking a bit further into the future — according to the 1 month rating Citi Trends, Inc. stock shows the buy signal. See more of Citi Trends, Inc. technicals for a more comprehensive analysis.
If you're still not sure, try looking for inspiration in our curated watchlists.
If you're still not sure, try looking for inspiration in our curated watchlists.