Next report date
—
Report period
—
EPS estimate
—
Revenue estimate
—
0.39 USD
24.39 M USD
237.12 M USD
38.13 M
About Hudson Technologies, Inc.
Sector
Industry
CEO
Brian F. Coleman
Website
Headquarters
Woodcliff Lake
Founded
1991
FIGI
BBG000DNV5K6
Hudson Technologies, Inc. is a refrigerant services company, which engages in the provision of solutions to recurring problems within the refrigeration industry. Its products and services are primarily used in commercial air conditioning, industrial processing, refrigeration systems, refrigerant and industrial gas sales, and refrigerant management services. The company was founded by Stephen P. Mandracchia and Kevin J. Zugibe on January 11, 1991 and is headquartered in Woodcliff Lake, NJ.
Related stocks

HDSN - Hudson Technologies, Inc.Had breakout on Friday. Noticeable volume on the shortened trading day. Don't mind buying around the Friday highs, prefer a small pullback maybe into the $11 area. Stops 2-3% below Friday's low.
Market environment is still making me want to realize quick gains, raise stops quickly.
Small cap (

HDSN heading on up $14.00HDSN is showing a classic bull formation for upside.
We have a Double Bottom accompanies by 7>21>200 Moving Averages.
Right now we are seeing a retest to the 21MA which hopefully it gets its catalyst for further upside.
I don't like how the breakout was treated, but the system is the system and t

Buy HDSN Technology Strong Fundamental
the company's still-low valuation multiples;
longer-term EPS growth because of HFCs account for the majority of F-gas emissions
California Bans Climate-Warming HFCs in New Air-Conditioning and Refrigeration and it's posibile to be extended to other state
Very Good Ran

$HDSN Setting Up Cup with Handle after Mini-Coil Cheat Setup$HDSN mini-coil cheat setup at 9.75 and moving higher. Look for it to pause and form a handle for a lower risk buy point

pair trading us stockSymbol: RIVN NASDAQ:RIVN
Short selling reason
time: 1.30pm
The turnover rate is 7%, the volume ratio is more than 1, and the decline is more than 7%. TTM PE loses money, annual income decreases, and short selling appears. It is a weak stock for half a day, and a weak stock for many days.
Symbol: H

HDSN might have finished the 3th WaveAfter a long correction Hudson Technologies seems to have completed a 3 waves move to the upside, (v) was a pip shy from the 61.8% Fib Ext , volume is drying, RSI already making lower highs and MACD decreasing, there's a high chance of a correction, that would be Wave 4th . We should wai

HDSN Ascending TriangleHDSN showing ascending triangle.
Wait until breakout to buy.
Target 1 @ 4.03
Target 2 @ 6.76


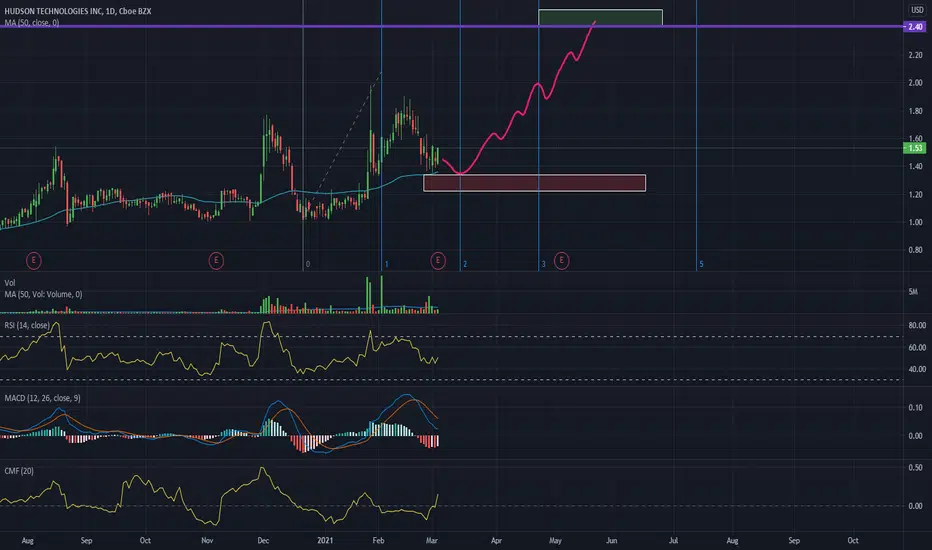
HDSN I think the target will be 2.4$HDSN is uptrend above MOV50
RSI > 40 MACD will cross
CMF > 0
I think the target will be 2.4
See all ideas
Summarizing what the indicators are suggesting.
Neutral
SellBuy
Strong sellStrong buy
Strong sellSellNeutralBuyStrong buy
Neutral
SellBuy
Strong sellStrong buy
Strong sellSellNeutralBuyStrong buy
Neutral
SellBuy
Strong sellStrong buy
Strong sellSellNeutralBuyStrong buy
An aggregate view of professional's ratings.
Neutral
SellBuy
Strong sellStrong buy
Strong sellSellNeutralBuyStrong buy
Neutral
SellBuy
Strong sellStrong buy
Strong sellSellNeutralBuyStrong buy
Neutral
SellBuy
Strong sellStrong buy
Strong sellSellNeutralBuyStrong buy
Displays a symbol's price movements over previous years to identify recurring trends.
Frequently Asked Questions
The current price of HDSN is 8.33 USD — it has increased by 0.97% in the past 24 hours. Watch Hudson Technologies, Inc. stock price performance more closely on the chart.
Depending on the exchange, the stock ticker may vary. For instance, on NASDAQ exchange Hudson Technologies, Inc. stocks are traded under the ticker HDSN.
HDSN stock has risen by 2.97% compared to the previous week, the month change is a 14.42% rise, over the last year Hudson Technologies, Inc. has showed a −0.48% decrease.
We've gathered analysts' opinions on Hudson Technologies, Inc. future price: according to them, HDSN price has a max estimate of 9.00 USD and a min estimate of 6.75 USD. Watch HDSN chart and read a more detailed Hudson Technologies, Inc. stock forecast: see what analysts think of Hudson Technologies, Inc. and suggest that you do with its stocks.
HDSN reached its all-time high on Apr 10, 1995 with the price of 27.50 USD, and its all-time low was 0.30 USD and was reached on Aug 23, 2019. View more price dynamics on HDSN chart.
See other stocks reaching their highest and lowest prices.
See other stocks reaching their highest and lowest prices.
HDSN stock is 1.45% volatile and has beta coefficient of 0.91. Track Hudson Technologies, Inc. stock price on the chart and check out the list of the most volatile stocks — is Hudson Technologies, Inc. there?
Today Hudson Technologies, Inc. has the market capitalization of 362.19 M, it has decreased by −0.12% over the last week.
Yes, you can track Hudson Technologies, Inc. financials in yearly and quarterly reports right on TradingView.
Hudson Technologies, Inc. is going to release the next earnings report on Jul 30, 2025. Keep track of upcoming events with our Earnings Calendar.
HDSN earnings for the last quarter are 0.06 USD per share, whereas the estimation was 0.05 USD resulting in a 20.00% surprise. The estimated earnings for the next quarter are 0.17 USD per share. See more details about Hudson Technologies, Inc. earnings.
Hudson Technologies, Inc. revenue for the last quarter amounts to 55.34 M USD, despite the estimated figure of 52.23 M USD. In the next quarter, revenue is expected to reach 71.66 M USD.
HDSN net income for the last quarter is 2.76 M USD, while the quarter before that showed −2.56 M USD of net income which accounts for 207.52% change. Track more Hudson Technologies, Inc. financial stats to get the full picture.
No, HDSN doesn't pay any dividends to its shareholders. But don't worry, we've prepared a list of high-dividend stocks for you.
As of Jul 9, 2025, the company has 238 employees. See our rating of the largest employees — is Hudson Technologies, Inc. on this list?
EBITDA measures a company's operating performance, its growth signifies an improvement in the efficiency of a company. Hudson Technologies, Inc. EBITDA is 26.44 M USD, and current EBITDA margin is 15.18%. See more stats in Hudson Technologies, Inc. financial statements.
Like other stocks, HDSN shares are traded on stock exchanges, e.g. Nasdaq, Nyse, Euronext, and the easiest way to buy them is through an online stock broker. To do this, you need to open an account and follow a broker's procedures, then start trading. You can trade Hudson Technologies, Inc. stock right from TradingView charts — choose your broker and connect to your account.
Investing in stocks requires a comprehensive research: you should carefully study all the available data, e.g. company's financials, related news, and its technical analysis. So Hudson Technologies, Inc. technincal analysis shows the buy rating today, and its 1 week rating is buy. Since market conditions are prone to changes, it's worth looking a bit further into the future — according to the 1 month rating Hudson Technologies, Inc. stock shows the buy signal. See more of Hudson Technologies, Inc. technicals for a more comprehensive analysis.
If you're still not sure, try looking for inspiration in our curated watchlists.
If you're still not sure, try looking for inspiration in our curated watchlists.