INOD - Daily - Breakout ReadyClick Here🖱️ and scroll down👇 for the technicals, and more behind this analysis!!!
________________________________________________________
________________________________________________________
..........✋NFA👍..........
📈Technical/Fundamental/Target Standpoint⬅️
This company shows strong financ
Next report date
—
Report period
—
EPS estimate
—
Revenue estimate
—
1.42 USD
28.66 M USD
170.46 M USD
30.42 M
About Innodata Inc.
Sector
Industry
CEO
Jack S. Abuhoff
Website
Headquarters
Ridgefield Park
Founded
1988
FIGI
BBG000BHZYZ8
Innodata, Inc. is a data engineering company, which engages in providing artificial intelligence software platforms and management of its services. It operates through the following business segments: Digital Data Solutions (DDS), Synodex, and Agility. The DDS segment combines deep neural networks and human expertise in multiple domains to make unstructured information useable. The Synodex segment enables clients in the insurance and healthcare sectors to transform medical records into useable digital data and to apply technologies to the digital data to augment decision support. The Agility segment provides tools and related professional services that enable public relations and communications professionals to discover influencers, amplify messages, monitor coverage, and measure the impact of campaigns. The company was founded by Todd H. Solomon in 1988 and is headquartered in Ridgefield Park, NJ.
Related stocks
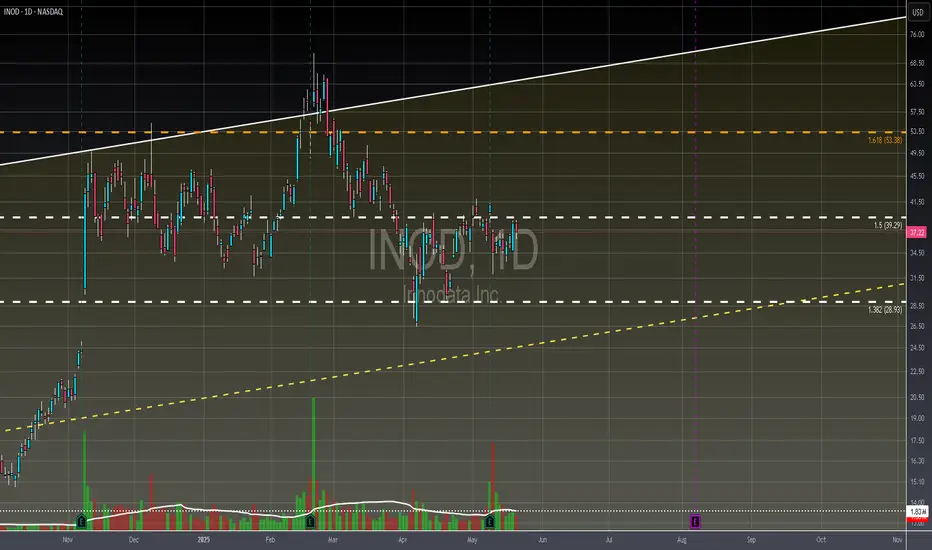
Breakout in Innodata Inc...Chart is self explanatory. Levels of breakout, possible up-moves (where stock may find resistances) and support (close below which, setup will be invalidated) are clearly defined.
Disclaimer: This is for demonstration and educational purpose only. This is not buying or selling recommendations. Plea

INOD-LONG This checks all the boxes and I bought 25 M in with a stop shown on chart ....
I actually need to research name still but I know it makes good eps/sales and has all my other requirements to trade as a top tier name.
Will update trade progression in comments .

Weekly sma20One of the greatest fake news about Chinese IA bring to a major sellout
Price reached weekly sma20 (gold line) on the bottom of red channel down
I expect a fast recovery in the following days
Stop below the red channel bottom

Symmetrical Triangle Pattern
Symmetrical Triangle Pattern:
A symmetrical triangle is a technical chart pattern characterized by converging trendlines. This pattern often indicates a period of consolidation, followed by a breakout.
Bullish Breakout : If the price breaks above the upper trendline, it is typically seen as a b

$INOD Potential Movement (11/11/24)Hey Traders,
NASDAQ:INOD was on fire today! After a stellar earnings report, it shot up from $24 and closed at $43—talk about aiming for Tesla territory! Right now, the main support we’re watching is at the previous higher high and break of structure zone around $37.84 on the 5-minute chart. And


INOD - 4 months HEAD & SHOULDERS══════════════════════════════
Since 2014, my markets approach is to spot
trading opportunities based solely on the
development of
CLASSICAL CHART PATTERNS
🤝Let’s learn and grow together 🤝
══════════════════════════════
Hello Traders ✌
After a careful consideration I came to the conclusion that:
-

Distribution is under wayThe market specialists have reached the target price of their markup campaign and are liquidating their positions to retail traders and investors. After the specialists have exited the market completely, the price will start to fall without their support.

INOD: Ascending Triangle (63%)Inod into an ascending triangle. May confirm tomorrow.
If confirmed, price target = 15.67$
Stay humble, Have fun, Make money!

See all ideas
Summarizing what the indicators are suggesting.
Neutral
SellBuy
Strong sellStrong buy
Strong sellSellNeutralBuyStrong buy
Neutral
SellBuy
Strong sellStrong buy
Strong sellSellNeutralBuyStrong buy
Neutral
SellBuy
Strong sellStrong buy
Strong sellSellNeutralBuyStrong buy
An aggregate view of professional's ratings.
Neutral
SellBuy
Strong sellStrong buy
Strong sellSellNeutralBuyStrong buy
Neutral
SellBuy
Strong sellStrong buy
Strong sellSellNeutralBuyStrong buy
Neutral
SellBuy
Strong sellStrong buy
Strong sellSellNeutralBuyStrong buy
Displays a symbol's price movements over previous years to identify recurring trends.
Frequently Asked Questions
The current price of INOD is 40.07 USD — it has decreased by −0.83% in the past 24 hours. Watch Innodata Inc. stock price performance more closely on the chart.
Depending on the exchange, the stock ticker may vary. For instance, on NASDAQ exchange Innodata Inc. stocks are traded under the ticker INOD.
INOD stock has fallen by −2.30% compared to the previous week, the month change is a −16.98% fall, over the last year Innodata Inc. has showed a 95.46% increase.
We've gathered analysts' opinions on Innodata Inc. future price: according to them, INOD price has a max estimate of 75.00 USD and a min estimate of 55.00 USD. Watch INOD chart and read a more detailed Innodata Inc. stock forecast: see what analysts think of Innodata Inc. and suggest that you do with its stocks.
INOD reached its all-time high on Feb 21, 2025 with the price of 71.00 USD, and its all-time low was 0.09 USD and was reached on Mar 26, 1998. View more price dynamics on INOD chart.
See other stocks reaching their highest and lowest prices.
See other stocks reaching their highest and lowest prices.
INOD stock is 8.91% volatile and has beta coefficient of 3.56. Track Innodata Inc. stock price on the chart and check out the list of the most volatile stocks — is Innodata Inc. there?
Today Innodata Inc. has the market capitalization of 1.39 B, it has decreased by −4.73% over the last week.
Yes, you can track Innodata Inc. financials in yearly and quarterly reports right on TradingView.
Innodata Inc. is going to release the next earnings report on Oct 30, 2025. Keep track of upcoming events with our Earnings Calendar.
INOD earnings for the last quarter are 0.20 USD per share, whereas the estimation was 0.11 USD resulting in a 79.25% surprise. The estimated earnings for the next quarter are 0.14 USD per share. See more details about Innodata Inc. earnings.
Innodata Inc. revenue for the last quarter amounts to 58.39 M USD, despite the estimated figure of 56.35 M USD. In the next quarter, revenue is expected to reach 59.79 M USD.
INOD net income for the last quarter is 7.22 M USD, while the quarter before that showed 7.79 M USD of net income which accounts for −7.29% change. Track more Innodata Inc. financial stats to get the full picture.
No, INOD doesn't pay any dividends to its shareholders. But don't worry, we've prepared a list of high-dividend stocks for you.
As of Aug 12, 2025, the company has 6.65 K employees. See our rating of the largest employees — is Innodata Inc. on this list?
EBITDA measures a company's operating performance, its growth signifies an improvement in the efficiency of a company. Innodata Inc. EBITDA is 46.41 M USD, and current EBITDA margin is 17.59%. See more stats in Innodata Inc. financial statements.
Like other stocks, INOD shares are traded on stock exchanges, e.g. Nasdaq, Nyse, Euronext, and the easiest way to buy them is through an online stock broker. To do this, you need to open an account and follow a broker's procedures, then start trading. You can trade Innodata Inc. stock right from TradingView charts — choose your broker and connect to your account.
Investing in stocks requires a comprehensive research: you should carefully study all the available data, e.g. company's financials, related news, and its technical analysis. So Innodata Inc. technincal analysis shows the sell today, and its 1 week rating is sell. Since market conditions are prone to changes, it's worth looking a bit further into the future — according to the 1 month rating Innodata Inc. stock shows the buy signal. See more of Innodata Inc. technicals for a more comprehensive analysis.
If you're still not sure, try looking for inspiration in our curated watchlists.
If you're still not sure, try looking for inspiration in our curated watchlists.