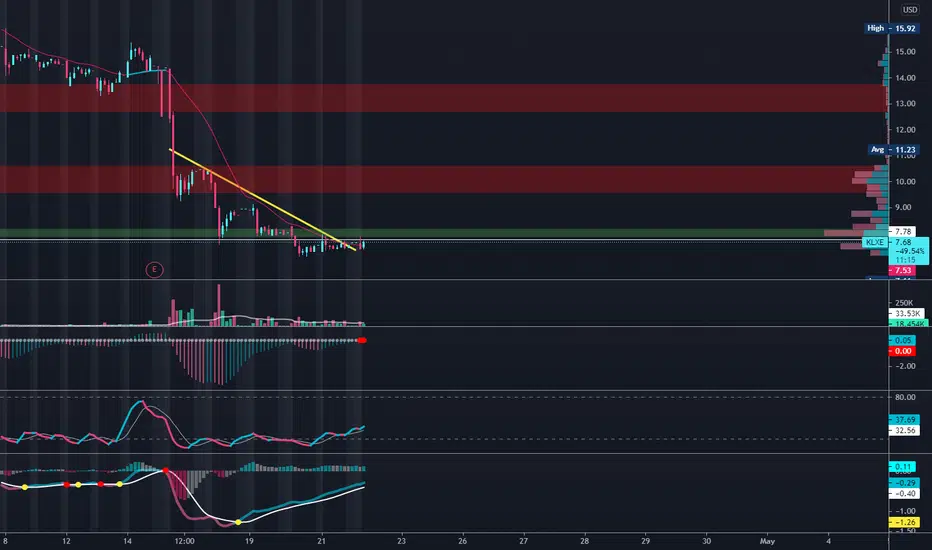
KLXE Long Trade Setup: Breakout Opportunity!Entry: Above $6.65 (Yellow Line) to confirm breakout.
Stop Loss (SL): Below $6.32 (White Line) for risk management.
Target 1 (T1): $7.06 (Red Line), the first resistance level.
Target 2 (T2): $7.60 (Green Line), the extended breakout target.
Strategy:
Wait for volume confirmation on the breakout an
Next report date
—
Report period
—
EPS estimate
—
Revenue estimate
—
−3.52 USD
−53.00 M USD
709.30 M USD
14.63 M
About KLX Energy Services Holdings, Inc.
Sector
Industry
CEO
Christopher J. Baker
Website
Headquarters
Houston
Founded
2018
FIGI
BBG00KTFHJJ0
KLX Energy Services Holdings, Inc. engages in the provision of completion, intervention and production services and products to onshore oil and gas producing regions. It operates through the following geographical segments: Southwest, Rocky Mountains and Northeast. The company was founded in 2018 and is headquartered in Houston, TX.
Related stocks

Basic supply demand setupOK, this stock has several things going for it. It’s an oil company. And we all know that clean energy is going to die in the next four years. So it time to pump oil and gas stocks once again.

Basic supply demand setupOK, this stock has several things going for it. It’s an oil company. And we all know that clean energy is going to die in the next four years. So it time to pump oil and gas stocks once again.

KLX Energy bounced off a floor. KLXEWe are not in the business of getting every prediction right, no one ever does and that is not the aim of the game. The Fibonacci targets are highlighted in green with invalidation in red. Fibonacci goals, it is prudent to suggest, are nothing more than mere fractally evident and therefore statistic

KLXE - Challenging the trendlineWe've tried the long term downtrend today.
We got a rejection today, but we have momentum.
Let's see how that goes :D

KLXE - 🚀 TimeIt looks to me like this chart has hit bottom.
The ATR is approaching a previous bottom, RSI is trending upwards, but price isn't quite following yet.
I'll save you some time doing DD - This company is a bag of crap - A huge pile of debt and cashflow concerns.
.. but it's always darkest before the

KLXE $2 SWING **HIGH ALERT**All,
Need full candle breakout here could easily move $2 maybe more. Not entering without full candles retest etc.
KLXE Trending UPA classic trend reversal as indicated by the 72.8% bump and a 72.8% retrace; the Cypher Pattern is in the final leg with a great upside potential.
Current price of $6.44; potential longer term target of approx. $37 by the end of Jan '21.
EES ;)

Chart looking bullish.MACD is looking stronger with green getting wider. Trading with huge volume on both candles that gaped up. No news on the company on why it went down or why it went up.

KLX Energy Services Holdings, 20 % upside trade KLX Energy Services Holdings, Inc. engages in the provision of completion, intervention and production services and products to onshore oil and gas producing regions. It operates through the following geographical segments: Southwest, Rocky Mountains and Northeast. The company was founded in 2018 an

See all ideas
Summarizing what the indicators are suggesting.
Oscillators
Neutral
SellBuy
Strong sellStrong buy
Strong sellSellNeutralBuyStrong buy
Oscillators
Neutral
SellBuy
Strong sellStrong buy
Strong sellSellNeutralBuyStrong buy
Summary
Neutral
SellBuy
Strong sellStrong buy
Strong sellSellNeutralBuyStrong buy
Summary
Neutral
SellBuy
Strong sellStrong buy
Strong sellSellNeutralBuyStrong buy
Summary
Neutral
SellBuy
Strong sellStrong buy
Strong sellSellNeutralBuyStrong buy
Moving Averages
Neutral
SellBuy
Strong sellStrong buy
Strong sellSellNeutralBuyStrong buy
Moving Averages
Neutral
SellBuy
Strong sellStrong buy
Strong sellSellNeutralBuyStrong buy
Displays a symbol's price movements over previous years to identify recurring trends.
KLXE6040091
KLX Energy Services Holdings, Inc. FRN 12-MAR-2030Yield to maturity
—
Maturity date
Mar 12, 2030
See all KLXE bonds
Frequently Asked Questions
The current price of KLXE is 2.30 USD — it has decreased by −15.44% in the past 24 hours. Watch KLX Energy Services Holdings, Inc. stock price performance more closely on the chart.
Depending on the exchange, the stock ticker may vary. For instance, on NASDAQ exchange KLX Energy Services Holdings, Inc. stocks are traded under the ticker KLXE.
KLXE stock has fallen by −0.86% compared to the previous week, the month change is a 15.00% rise, over the last year KLX Energy Services Holdings, Inc. has showed a −48.20% decrease.
We've gathered analysts' opinions on KLX Energy Services Holdings, Inc. future price: according to them, KLXE price has a max estimate of 5.00 USD and a min estimate of 5.00 USD. Watch KLXE chart and read a more detailed KLX Energy Services Holdings, Inc. stock forecast: see what analysts think of KLX Energy Services Holdings, Inc. and suggest that you do with its stocks.
KLXE reached its all-time high on Oct 22, 2018 with the price of 180.65 USD, and its all-time low was 1.51 USD and was reached on Apr 9, 2025. View more price dynamics on KLXE chart.
See other stocks reaching their highest and lowest prices.
See other stocks reaching their highest and lowest prices.
KLXE stock is 19.73% volatile and has beta coefficient of 1.92. Track KLX Energy Services Holdings, Inc. stock price on the chart and check out the list of the most volatile stocks — is KLX Energy Services Holdings, Inc. there?
Today KLX Energy Services Holdings, Inc. has the market capitalization of 40.37 M, it has increased by 23.64% over the last week.
Yes, you can track KLX Energy Services Holdings, Inc. financials in yearly and quarterly reports right on TradingView.
KLX Energy Services Holdings, Inc. is going to release the next earnings report on Aug 6, 2025. Keep track of upcoming events with our Earnings Calendar.
KLXE earnings for the last quarter are −1.27 USD per share, whereas the estimation was −0.86 USD resulting in a −47.67% surprise. The estimated earnings for the next quarter are −0.62 USD per share. See more details about KLX Energy Services Holdings, Inc. earnings.
KLX Energy Services Holdings, Inc. revenue for the last quarter amounts to 154.00 M USD, despite the estimated figure of 160.80 M USD. In the next quarter, revenue is expected to reach 163.50 M USD.
KLXE net income for the last quarter is −27.90 M USD, while the quarter before that showed −14.70 M USD of net income which accounts for −89.80% change. Track more KLX Energy Services Holdings, Inc. financial stats to get the full picture.
No, KLXE doesn't pay any dividends to its shareholders. But don't worry, we've prepared a list of high-dividend stocks for you.
As of Jun 22, 2025, the company has 1.73 K employees. See our rating of the largest employees — is KLX Energy Services Holdings, Inc. on this list?
EBITDA measures a company's operating performance, its growth signifies an improvement in the efficiency of a company. KLX Energy Services Holdings, Inc. EBITDA is 77.90 M USD, and current EBITDA margin is 11.08%. See more stats in KLX Energy Services Holdings, Inc. financial statements.
Like other stocks, KLXE shares are traded on stock exchanges, e.g. Nasdaq, Nyse, Euronext, and the easiest way to buy them is through an online stock broker. To do this, you need to open an account and follow a broker's procedures, then start trading. You can trade KLX Energy Services Holdings, Inc. stock right from TradingView charts — choose your broker and connect to your account.
Investing in stocks requires a comprehensive research: you should carefully study all the available data, e.g. company's financials, related news, and its technical analysis. So KLX Energy Services Holdings, Inc. technincal analysis shows the sell today, and its 1 week rating is sell. Since market conditions are prone to changes, it's worth looking a bit further into the future — according to the 1 month rating KLX Energy Services Holdings, Inc. stock shows the sell signal. See more of KLX Energy Services Holdings, Inc. technicals for a more comprehensive analysis.
If you're still not sure, try looking for inspiration in our curated watchlists.
If you're still not sure, try looking for inspiration in our curated watchlists.