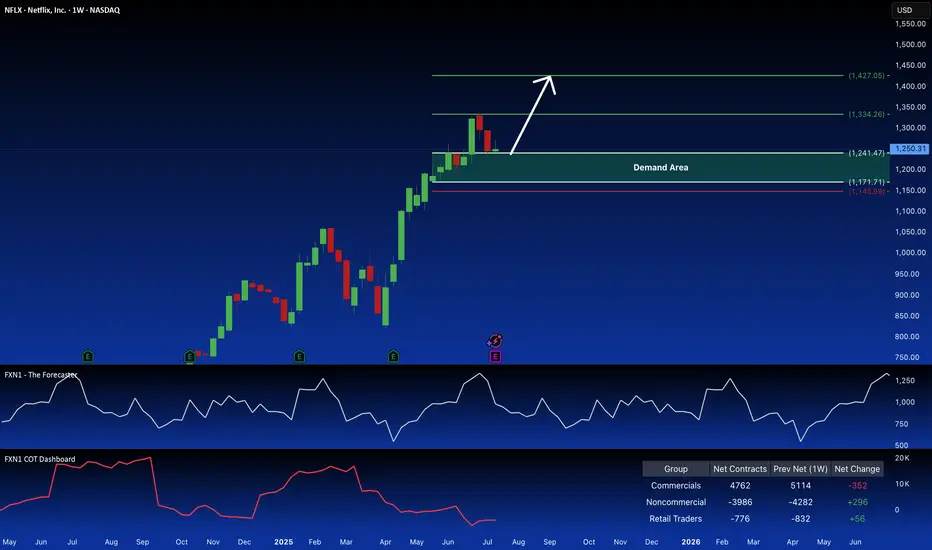
NFLX: Bullish Signal in Demand ZoneNetflix (NFLX) recently retraced within a key weekly demand zone, potentially presenting a long opportunity. Non-commercial traders are also accumulating long positions in the stock. This suggests a possible bullish setup. Your thoughts?
✅ Please share your thoughts about NFLX in the comments
Next report date
—
Report period
—
EPS estimate
—
Revenue estimate
—
24.00 USD
8.71 B USD
38.88 B USD
422.14 M
About Netflix, Inc.
Sector
Industry
Website
Headquarters
Los Gatos
Founded
1997
FIGI
BBG000CL9VN6
Netflix, Inc operates as a streaming entertainment service company. The firm provides subscription service streaming movies and television episodes over the Internet and sending DVDs by mail. It operates through the following segments: Domestic Streaming, International Streaming and Domestic DVD. The Domestic Streaming segment derives revenues from monthly membership fees for services consisting of streaming content to its members in the United States. The International Streaming segment includes fees from members outside the United States. The Domestic DVD segment covers revenues from services consisting of DVD-by-mail. The company was founded by Marc Randolph and Wilmot Reed Hastings Jr. on August 29, 1997 and is headquartered in Los Gatos, CA.
Related stocks
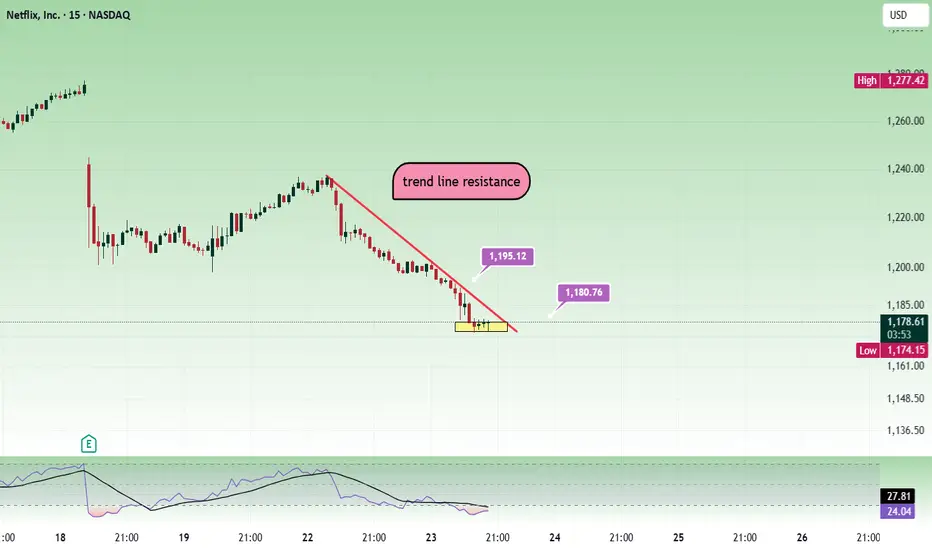
NetflixMay be people are not watching Netflix nowadays and the price is falling. 1200 is a strong resistance.
Sell below 1180 with the stop loss of 1195 for the targets 1165, 1150, 1130 and 1115.
Price can pull back towards 1190 and then fall. Its better to see bearish confirmation and trade.
Always do you
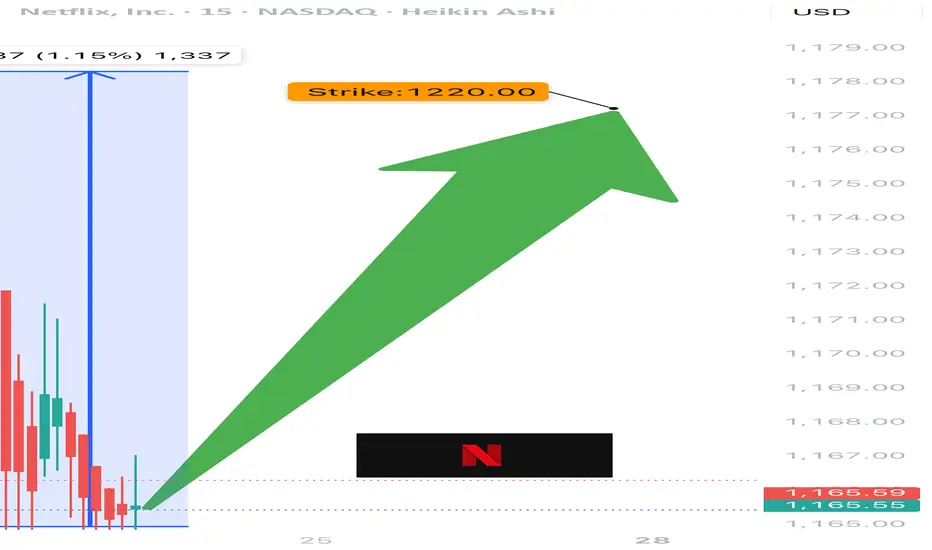
NFLX TRADE IDEA (07/24)
🚨 NFLX TRADE IDEA (07/24) 🚨
⚔️ Bulls vs. Bears… but calls are winning 🐂📈
🧠 Quick Breakdown:
• Call/Put Ratio: 1.27 → bullish edge
• RSI < 45 = 🔻oversold territory
• VIX favorable = room to run
• High gamma = big moves incoming ⚡️
• Expiry: TOMORROW = 🔥 time decay risk
💥 TRADE SETUP
🟢 Buy NFLX $12
Netflix Stock Drops After Earnings ReleaseShortly after publishing its financial results, Netflix posted a decline of over 5% toward the end of the week and continues to show a strong bearish bias. This comes despite reporting a positive earnings per share (EPS) figure of $7.19, beating the expected $7.08, and revenue of $11.08 billion, sli
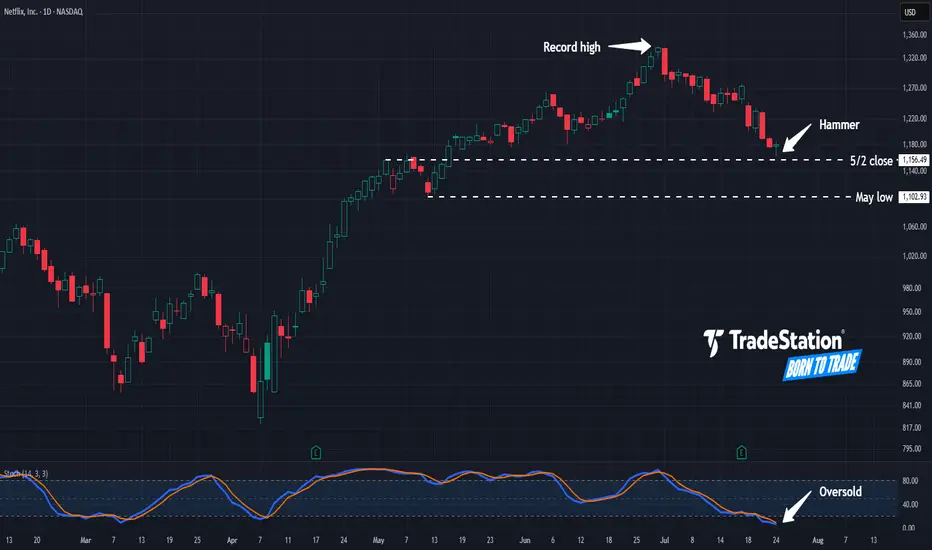
Hammer in NetflixNetflix has pulled back from record highs, and some traders may see potential opportunities in the streaming video giant.
The first pattern on today’s chart is the $1,156.49 level. It was a weekly close on May 2 and near the high the following week. NFLX is now showing signs of potential stabilizat
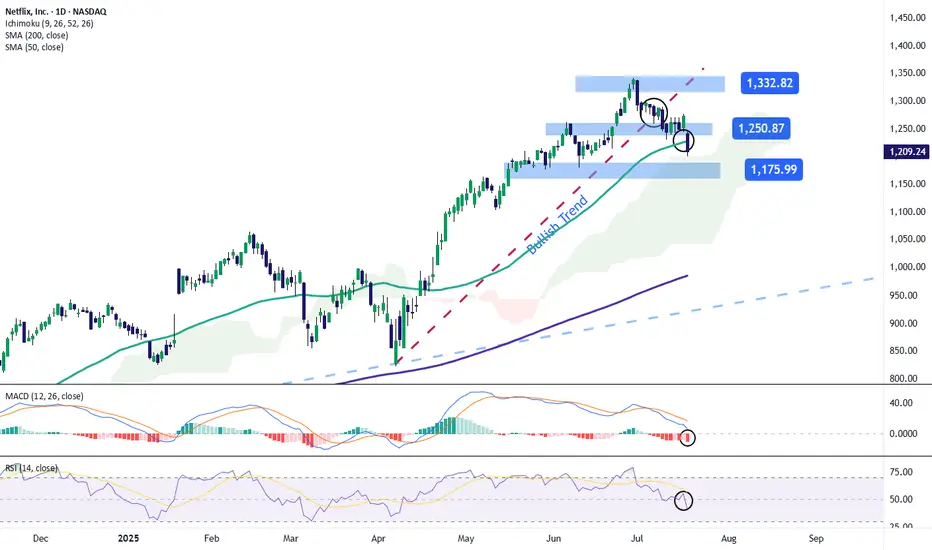
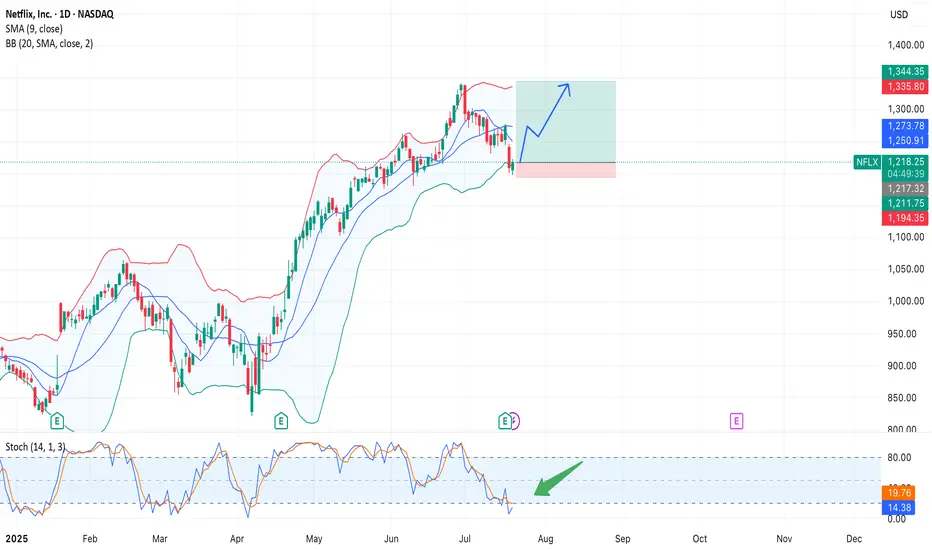
Netflix (NFLX) Long Setup – Bounce from Lower Bollinger Band $NASDAQ:NFLX. After pulling back from the $1350 area, Netflix stock is testing the lower Bollinger Band (BB 20/2σ), a level that previously acted as support.
At the same time, the Stochastic Oscillator (14,1,3) is in oversold territory and starting to curl upward, suggesting a potential bullish reve
NFLX WEEKLY BEARISH PLAY — 07/23/2025
📉 NFLX WEEKLY BEARISH PLAY — 07/23/2025
🧠 Multi-model AI Consensus Trade Setup
⸻
🔍 QUICK SUMMARY
After reviewing 5 AI model reports (Grok, Gemini, Claude, Meta, DeepSeek), the consensus is moderate bearish for NFLX this week following heavy institutional selling and post-earnings weakness.
💣 Ke

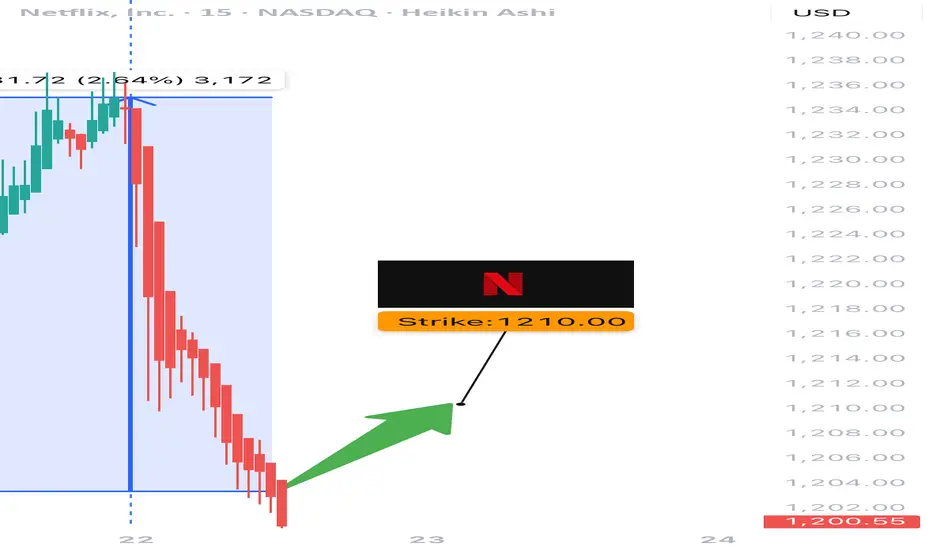
$NFLX Weekly Call Setup – 07/22/25
🚀 NASDAQ:NFLX Weekly Call Setup – 07/22/25
Volume Surge 📈 | RSI Bullish ✅ | Options Flow Mixed 🔁 | 3DTE Lotto Play 🎯
⸻
📊 Market Snapshot
• Price: $1203.16
• Call/Put Ratio: 1.01 → ⚖️ Neutral
• Weekly RSI: ✅ 63.2 (Momentum confirmed)
• Volume Surge: 📈 1.6x previous week
• Gamma Risk: ⚠️ Mo
Watching: NFLXKeep an eye on NFLX. It is setting up for a potential bounce if we can get a close above the 5-SMA. Cheers!

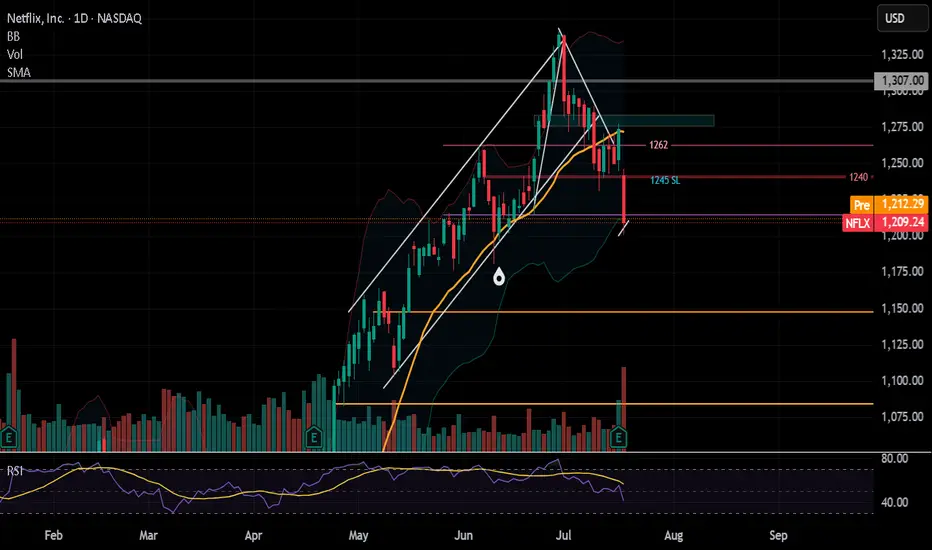
NFLX weak... gapping up to head back downWatching Monday... looking for continuation to downside. This week into next week. 1245 zone is where the post earnings gap down and go started. Using this as my stop loss.
Targets 1200 down to 1180.
See all ideas
Summarizing what the indicators are suggesting.
Neutral
SellBuy
Strong sellStrong buy
Strong sellSellNeutralBuyStrong buy
Neutral
SellBuy
Strong sellStrong buy
Strong sellSellNeutralBuyStrong buy
Neutral
SellBuy
Strong sellStrong buy
Strong sellSellNeutralBuyStrong buy
An aggregate view of professional's ratings.
Neutral
SellBuy
Strong sellStrong buy
Strong sellSellNeutralBuyStrong buy
Neutral
SellBuy
Strong sellStrong buy
Strong sellSellNeutralBuyStrong buy
Neutral
SellBuy
Strong sellStrong buy
Strong sellSellNeutralBuyStrong buy
Displays a symbol's price movements over previous years to identify recurring trends.
NFLX5862368
Netflix, Inc. 5.4% 15-AUG-2054Yield to maturity
5.62%
Maturity date
Aug 15, 2054
NFLX5862367
Netflix, Inc. 4.9% 15-AUG-2034Yield to maturity
4.44%
Maturity date
Aug 15, 2034
USU74079AN1
NETFLIX 19/29 REGSYield to maturity
4.40%
Maturity date
Nov 15, 2029
NFLX4901374
Netflix, Inc. 4.875% 15-JUN-2030Yield to maturity
4.21%
Maturity date
Jun 15, 2030
NFLX4764899
Netflix, Inc. 4.875% 15-APR-2028Yield to maturity
4.19%
Maturity date
Apr 15, 2028
NFLX4908613
Netflix, Inc. 6.375% 15-MAY-2029Yield to maturity
4.17%
Maturity date
May 15, 2029
NFLX4826528
Netflix, Inc. 5.875% 15-NOV-2028Yield to maturity
4.11%
Maturity date
Nov 15, 2028
US64110LAN64
NETFLIX 4.375% CALL 15NV26Yield to maturity
4.01%
Maturity date
Nov 15, 2026
XS198938050
NETFLIX 19/29 144AYield to maturity
3.48%
Maturity date
Nov 15, 2029
XS207282979
NETFLIX INC. 19/30 REGSYield to maturity
2.80%
Maturity date
Jun 15, 2030
XS198938017
NETFLIX 19/29 REGSYield to maturity
2.75%
Maturity date
Nov 15, 2029
See all NFLX bonds
Curated watchlists where NFLX is featured.


Frequently Asked Questions
The current price of NFLX is 1,180.49 USD — it has decreased by −0.02% in the past 24 hours. Watch Netflix, Inc. stock price performance more closely on the chart.
Depending on the exchange, the stock ticker may vary. For instance, on NASDAQ exchange Netflix, Inc. stocks are traded under the ticker NFLX.
NFLX stock has fallen by −4.95% compared to the previous week, the month change is a −8.26% fall, over the last year Netflix, Inc. has showed a 84.16% increase.
We've gathered analysts' opinions on Netflix, Inc. future price: according to them, NFLX price has a max estimate of 1,600.00 USD and a min estimate of 833.00 USD. Watch NFLX chart and read a more detailed Netflix, Inc. stock forecast: see what analysts think of Netflix, Inc. and suggest that you do with its stocks.
NFLX reached its all-time high on Jun 30, 2025 with the price of 1,341.15 USD, and its all-time low was 0.35 USD and was reached on Oct 10, 2002. View more price dynamics on NFLX chart.
See other stocks reaching their highest and lowest prices.
See other stocks reaching their highest and lowest prices.
NFLX stock is 1.10% volatile and has beta coefficient of 1.25. Track Netflix, Inc. stock price on the chart and check out the list of the most volatile stocks — is Netflix, Inc. there?
Today Netflix, Inc. has the market capitalization of 501.62 B, it has decreased by −0.02% over the last week.
Yes, you can track Netflix, Inc. financials in yearly and quarterly reports right on TradingView.
Netflix, Inc. is going to release the next earnings report on Oct 15, 2025. Keep track of upcoming events with our Earnings Calendar.
NFLX earnings for the last quarter are 7.19 USD per share, whereas the estimation was 7.07 USD resulting in a 1.75% surprise. The estimated earnings for the next quarter are 6.92 USD per share. See more details about Netflix, Inc. earnings.
Netflix, Inc. revenue for the last quarter amounts to 11.08 B USD, despite the estimated figure of 11.06 B USD. In the next quarter, revenue is expected to reach 11.51 B USD.
NFLX net income for the last quarter is 3.13 B USD, while the quarter before that showed 2.89 B USD of net income which accounts for 8.13% change. Track more Netflix, Inc. financial stats to get the full picture.
No, NFLX doesn't pay any dividends to its shareholders. But don't worry, we've prepared a list of high-dividend stocks for you.
As of Jul 27, 2025, the company has 14 K employees. See our rating of the largest employees — is Netflix, Inc. on this list?
EBITDA measures a company's operating performance, its growth signifies an improvement in the efficiency of a company. Netflix, Inc. EBITDA is 27.91 B USD, and current EBITDA margin is 66.68%. See more stats in Netflix, Inc. financial statements.
Like other stocks, NFLX shares are traded on stock exchanges, e.g. Nasdaq, Nyse, Euronext, and the easiest way to buy them is through an online stock broker. To do this, you need to open an account and follow a broker's procedures, then start trading. You can trade Netflix, Inc. stock right from TradingView charts — choose your broker and connect to your account.
Investing in stocks requires a comprehensive research: you should carefully study all the available data, e.g. company's financials, related news, and its technical analysis. So Netflix, Inc. technincal analysis shows the neutral today, and its 1 week rating is buy. Since market conditions are prone to changes, it's worth looking a bit further into the future — according to the 1 month rating Netflix, Inc. stock shows the buy signal. See more of Netflix, Inc. technicals for a more comprehensive analysis.
If you're still not sure, try looking for inspiration in our curated watchlists.
If you're still not sure, try looking for inspiration in our curated watchlists.