Satellogic (SATL): Earth Observation Demand Drives SupportSatellogic Inc. (SATL) is a space tech company focused on Earth observation, building and operating a growing constellation of high-resolution satellites. These satellites capture detailed imagery and data, serving industries like agriculture, energy, defense, and environmental monitoring. By offeri
−1.28 USD
−116.27 M USD
12.87 M USD
48.53 M
About Satellogic Inc.
Sector
Industry
CEO
Emiliano Kargieman
Website
Headquarters
Davidson
Founded
2010
FIGI
BBG0135WF1H9
Satellogic, Inc. operates as a vertically integrated geospatial company. It is creating and continuously enhancing the first scalable, fully automated EO platform with the ability to remap the entire planet at both high-frequency and high-resolution, providing accessible and affordable solutions for customers. The company was founded by Emiliano Kargieman and Gerardo Richarte in July 2010 and is headquartered in Davidson, NC.

Long Trade Setup Breakdown for Satellogic Inc. (SATL) - 30-Min 📊
🔹 Asset: Satellogic Inc. (SATL)
🔹 Timeframe: 30-Min Chart
🔹 Setup Type: Symmetrical Triangle Breakout
🚀 Trade Plan (Long Position):
✅ Entry Zone: $4.54 (Breakout Confirmation)
✅ Stop-Loss (SL): $4.24 (Below Support)
🎯 Take Profit Targets (Long Trade):
📌 TP1: $4.94 (First Resistance)
📌 TP2: $5.34

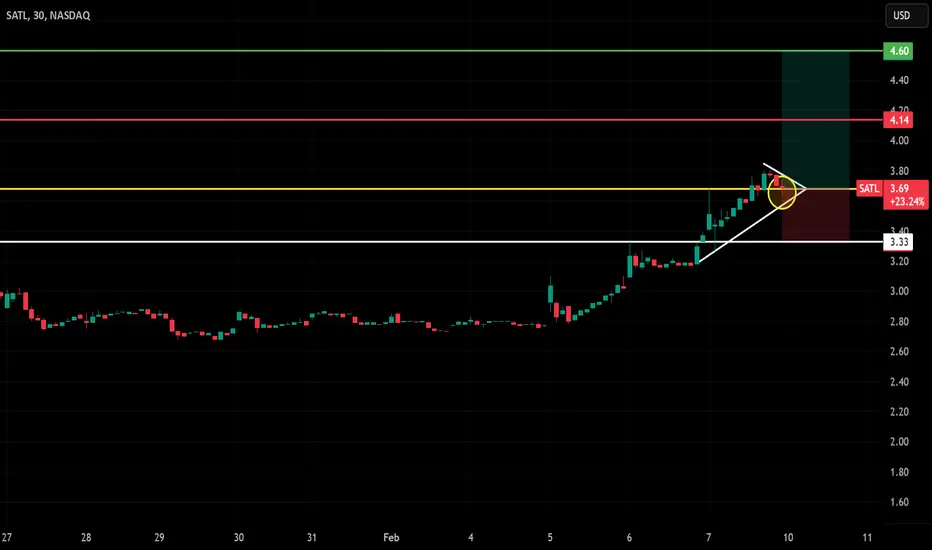
SATL (NASDAQ) - 30-Min Chart Long Trade Setup for Monday !🔥 🚀
🔍 Stock: SATL (NASDAQ)
⏳ Timeframe: 30-Min Chart
📈 Setup Type: Bullish Breakout
📍 Trade Plan:
✅ Entry Zone: Above $3.69 - $4.14 (Breakout Confirmation)
🟢 Take Profit 1 (TP1): $4.14 (First Resistance Target)
🟢 Take Profit 2 (TP2): $4.60 (Extended Bullish Target)
🚀 Stop-Loss (SL): Below $3.33 (Ke
Satellogic (SATL): Earth Imaging Demand Continues to GrowSatellogic Inc. (SATL) is a leader in Earth imaging, using a fleet of high-resolution satellites to provide real-time data for governments, businesses, and researchers. Their technology delivers detailed images that help with agriculture, environmental monitoring, and infrastructure planning. The co

SATL: Triangle Pattern - Monday’s Key Levels!📊 Description:
SATL is consolidating within a symmetrical triangle pattern, signaling a potential breakout or breakdown. Key levels to watch:
Breakout Above: $4.05 (upside potential to $5.48)
Breakdown Below: $2.50 (downside risk to $2.30)
Volume and momentum will be critical to confirm the move. M

Swing trade thisOnly if this enters into 4 would I open a long trade. I'd exit at 5.2. I estimate the trade will be about a month. Stop-loss at 3.35 though I doubt that'll be hit.

See all ideas
Summarizing what the indicators are suggesting.
Oscillators
Neutral
SellBuy
Strong sellStrong buy
Strong sellSellNeutralBuyStrong buy
Oscillators
Neutral
SellBuy
Strong sellStrong buy
Strong sellSellNeutralBuyStrong buy
Summary
Neutral
SellBuy
Strong sellStrong buy
Strong sellSellNeutralBuyStrong buy
Summary
Neutral
SellBuy
Strong sellStrong buy
Strong sellSellNeutralBuyStrong buy
Summary
Neutral
SellBuy
Strong sellStrong buy
Strong sellSellNeutralBuyStrong buy
Moving Averages
Neutral
SellBuy
Strong sellStrong buy
Strong sellSellNeutralBuyStrong buy
Moving Averages
Neutral
SellBuy
Strong sellStrong buy
Strong sellSellNeutralBuyStrong buy
Displays a symbol's price movements over previous years to identify recurring trends.
Curated watchlists where SATL is featured.

Related stocks
Frequently Asked Questions
The current price of SATL is 3.52 USD — it has increased by 6.34% in the past 24 hours. Watch Satellogic Inc. stock price performance more closely on the chart.
Depending on the exchange, the stock ticker may vary. For instance, on NASDAQ exchange Satellogic Inc. stocks are traded under the ticker SATL.
SATL stock has fallen by −1.68% compared to the previous week, the month change is a −13.51% fall, over the last year Satellogic Inc. has showed a 222.94% increase.
SATL reached its all-time high on Jan 21, 2022 with the price of 12.33 USD, and its all-time low was 0.69 USD and was reached on Nov 14, 2023. View more price dynamics on SATL chart.
See other stocks reaching their highest and lowest prices.
See other stocks reaching their highest and lowest prices.
SATL stock is 7.27% volatile and has beta coefficient of 2.01. Track Satellogic Inc. stock price on the chart and check out the list of the most volatile stocks — is Satellogic Inc. there?
Today Satellogic Inc. has the market capitalization of 366.47 M, it has decreased by −0.30% over the last week.
Yes, you can track Satellogic Inc. financials in yearly and quarterly reports right on TradingView.
SATL net income for the last quarter is −32.58 M USD, while the quarter before that showed −13.55 M USD of net income which accounts for −140.49% change. Track more Satellogic Inc. financial stats to get the full picture.
No, SATL doesn't pay any dividends to its shareholders. But don't worry, we've prepared a list of high-dividend stocks for you.
As of Jun 19, 2025, the company has 137 employees. See our rating of the largest employees — is Satellogic Inc. on this list?
EBITDA measures a company's operating performance, its growth signifies an improvement in the efficiency of a company. Satellogic Inc. EBITDA is −52.87 M USD, and current EBITDA margin is −307.31%. See more stats in Satellogic Inc. financial statements.
Like other stocks, SATL shares are traded on stock exchanges, e.g. Nasdaq, Nyse, Euronext, and the easiest way to buy them is through an online stock broker. To do this, you need to open an account and follow a broker's procedures, then start trading. You can trade Satellogic Inc. stock right from TradingView charts — choose your broker and connect to your account.
Investing in stocks requires a comprehensive research: you should carefully study all the available data, e.g. company's financials, related news, and its technical analysis. So Satellogic Inc. technincal analysis shows the neutral today, and its 1 week rating is neutral. Since market conditions are prone to changes, it's worth looking a bit further into the future — according to the 1 month rating Satellogic Inc. stock shows the buy signal. See more of Satellogic Inc. technicals for a more comprehensive analysis.
If you're still not sure, try looking for inspiration in our curated watchlists.
If you're still not sure, try looking for inspiration in our curated watchlists.