Why We See 100%+ Upside In SoFi Over The Next 3 YearsAfter soaring to nearly $28 per share during the SPAC-fueled fintech boom in 2021, SoFi Technologies (SOFI) crashed back to earth, trading under $5 as rising interest rates, regulatory headwinds, and lack of profitability dimmed investor optimism. But the tide has turned.
Over the past year, SoFi h
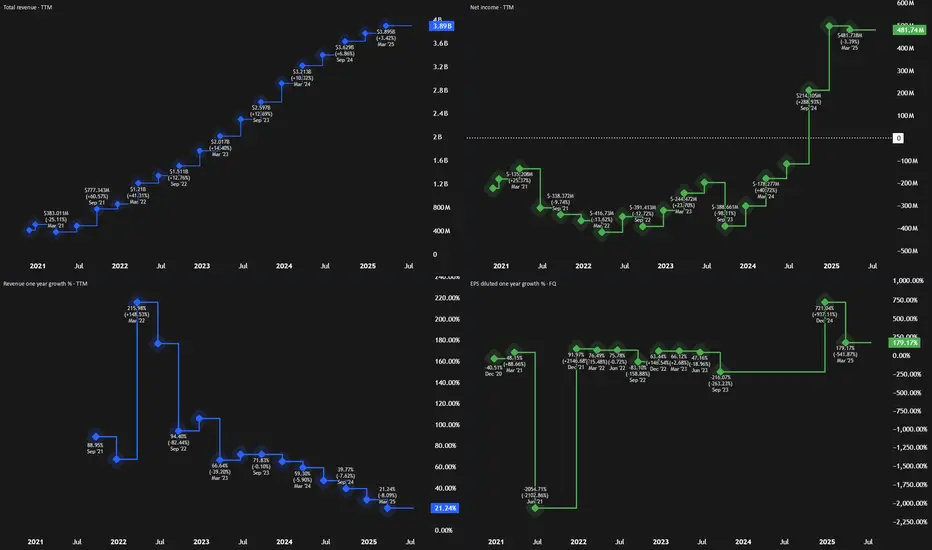
Key facts today
Next report date
—
Report period
—
EPS estimate
—
Revenue estimate
—
0.43 USD
498.67 M USD
3.77 B USD
1.08 B
About SoFi Technologies, Inc.
Sector
Industry
CEO
Anthony J. Noto
Website
Headquarters
San Francisco
Founded
2011
FIGI
BBG00YB1ZD58
SoFi Technologies, Inc. is a financial service platform, which engages in the provision of student loan refinancing options to the private student loan market. It operates through the following segments: Lending, Technology Platform, and Financial Services. The Lending segment offers personal loans, student loans, home loan products, and related servicing activities. The Technology Platform segment focuses on technology products and solutions revenue. The Financial Services segment includes the SoFi Money product, SoFi Invest product, SoFi Credit Card product, SoFi Relay personal finance management product, and other financial services such as lead generation and content for other financial services institutions. The company was founded in 2011 and is headquartered in San Francisco, CA.
Related stocks
SoFi: On the Road to ATH ResistanceAfter clearing over 100 lines off my chart, I wanted to take a clean, fresh look at SoFi heading into the upcoming earnings report — just to gain a new perspective on where we stand.
Weekly chart. As simple as it gets.
What I’m seeing: a breakout from a classic cup-and-handle formation, with the b

Positioned for an Earnings-Driven Upside Opportunity Current Price: $21.20
Direction: LONG
Targets:
- T1 = $22.80
- T2 = $23.60
Stop Levels:
- S1 = $20.60
- S2 = $19.90
**Wisdom of Professional Traders:**
This analysis synthesizes insights from thousands of professional traders and market experts, leveraging collective intelligence to i
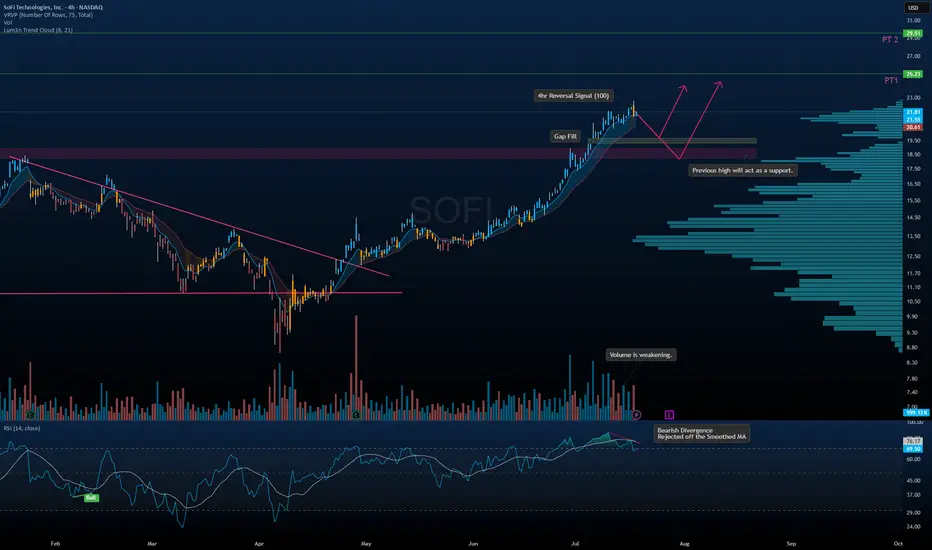
$SOFI - Long-Term Setup Brewing? Pullback First?I’m extremely bullish on SoFi long-term, but the chart is signaling a potential pullback opportunity before the next leg up.
🔹 Technical Breakdown:
• Bearish Divergence on RSI with rejection off the smoothed MA
• Volume weakening as price moves higher – classic sign of exhaustion
• 4hr Reversal Sig
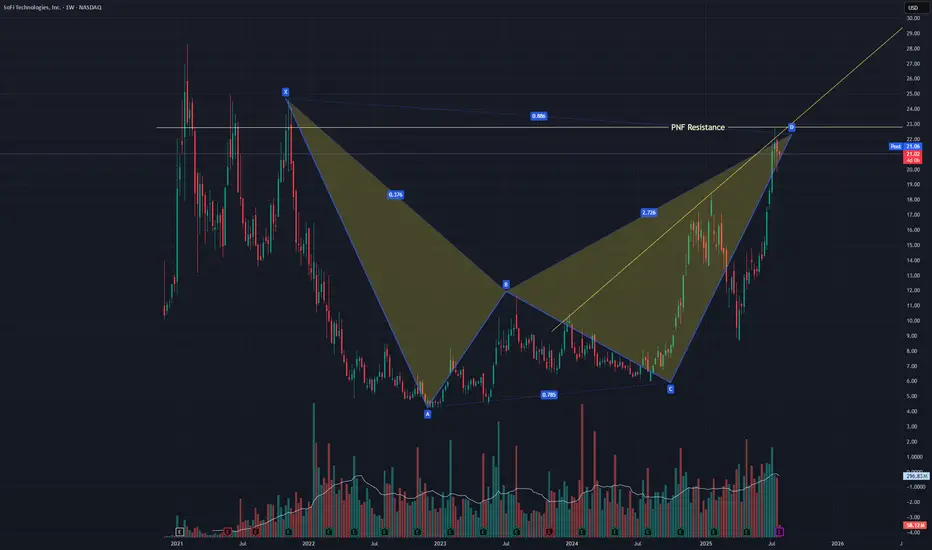
SOFI Pullback most likely comingNASDAQ:SOFI just finished a bearish bat harmonic and failed to break a resistance line I have from a PNF chart. It also failed a back test of a trendline of resistance in this uptrend. A pullback is likely but in this irrational market any thing could happen. I did a strangle +-5% just in case.
SoFi's Surge: Unveiling 2023 and What Lies Ahead in 2024Technical Analysis Overview
Current Price : $10.34, a 3.77% increase.
Weekly Trend : Showing a positive trend with a 5.35% increase over the last five days.
1-Month Trend : A significant increase of 51.96%, indicating strong bullish sentiment.
6-Month and Yearly Trends : A 17.04% increase ov

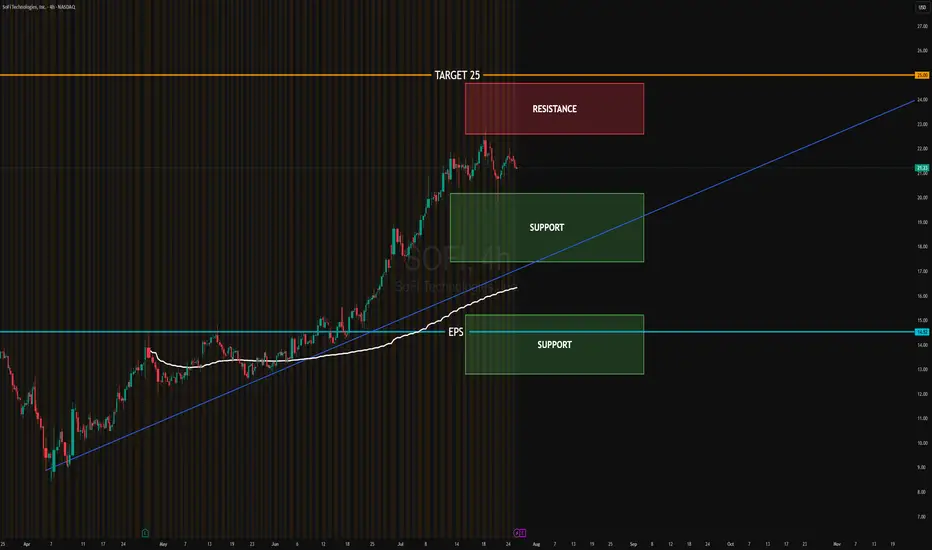
SOFI EARNINGSResistance Zone: $22.50 – $24.00
Support Zone 1: $18.00 – $19.50
Support Zone 2 / EPS Breakout Line: $14.50
Bullish Target: $25.00
Trendline: Still intact — medium-term trend remains bullish
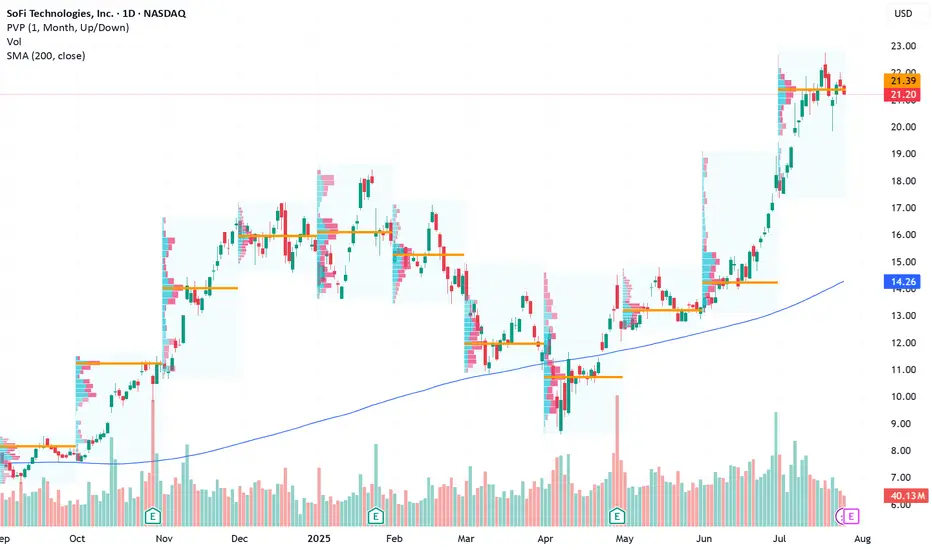
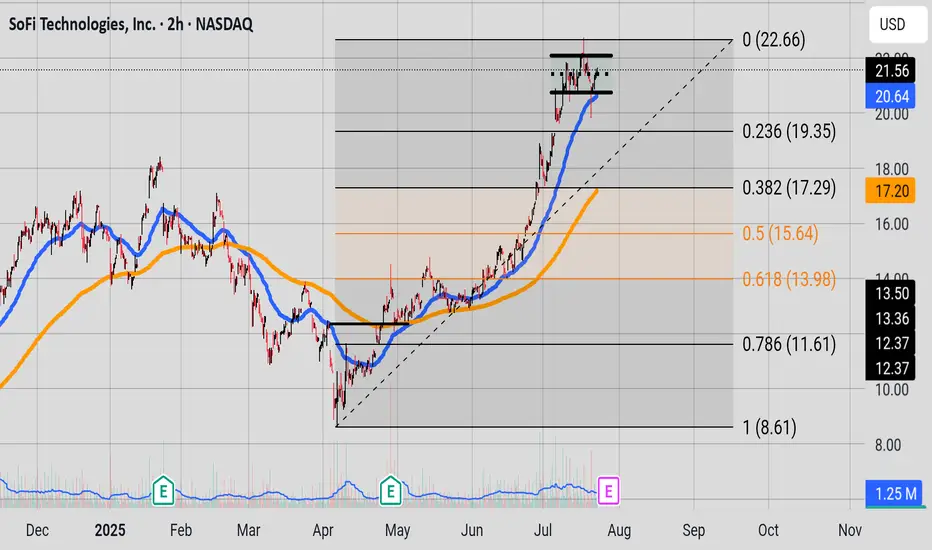
Parallel StructureWe have a nice parallel structure sitting on top of a 50 EMA (in blue). A consolidation is happening. Interestly enough the 200 EMA(in orange) is close to the 0.382 Fib level. On the weekly chart you can see the bears gearing up. But the bulls are still in charge. Price needs to hold the 20.64 price
High Wave CandleSOFI has finally reached it's resistance level around 23.84. Last week candle was a High Wave Candle. If we get a strong close above 23.84 that probably means the bulls are marching on, if we get a bearish close below 19.55 that may mean the bears have stepped in and are looking to pull prices do

How to Do Your “Trading Homework” (The Smart Way)
If you’ve been following this channel, you’ve heard me say it many times:
Trading is war — and you should never enter a battle unprepared.
But here’s the real question:
How exactly do you prepare?
The answer lies in a powerful strategy I use called:
💡 Thematic Investing
Read more here →
Instead of

See all ideas
Summarizing what the indicators are suggesting.
Neutral
SellBuy
Strong sellStrong buy
Strong sellSellNeutralBuyStrong buy
Neutral
SellBuy
Strong sellStrong buy
Strong sellSellNeutralBuyStrong buy
Neutral
SellBuy
Strong sellStrong buy
Strong sellSellNeutralBuyStrong buy
An aggregate view of professional's ratings.
Neutral
SellBuy
Strong sellStrong buy
Strong sellSellNeutralBuyStrong buy
Neutral
SellBuy
Strong sellStrong buy
Strong sellSellNeutralBuyStrong buy
Neutral
SellBuy
Strong sellStrong buy
Strong sellSellNeutralBuyStrong buy
Displays a symbol's price movements over previous years to identify recurring trends.
US83406FAA0
SOFI TECH. 21/26 ZO CVYield to maturity
−11.95%
Maturity date
Oct 15, 2026
US83406FAC6
SOFI TECH. 24/29 CV 144Yield to maturity
−15.17%
Maturity date
Mar 15, 2029
See all SOFI bonds
Curated watchlists where SOFI is featured.


Frequently Asked Questions
The current price of SOFI is 21.02 USD — it has decreased by −1.44% in the past 24 hours. Watch SoFi Technologies, Inc. stock price performance more closely on the chart.
Depending on the exchange, the stock ticker may vary. For instance, on NASDAQ exchange SoFi Technologies, Inc. stocks are traded under the ticker SOFI.
SOFI stock has fallen by −4.95% compared to the previous week, the month change is a 32.33% rise, over the last year SoFi Technologies, Inc. has showed a 181.02% increase.
We've gathered analysts' opinions on SoFi Technologies, Inc. future price: according to them, SOFI price has a max estimate of 27.00 USD and a min estimate of 6.00 USD. Watch SOFI chart and read a more detailed SoFi Technologies, Inc. stock forecast: see what analysts think of SoFi Technologies, Inc. and suggest that you do with its stocks.
SOFI reached its all-time high on Feb 1, 2021 with the price of 28.26 USD, and its all-time low was 4.24 USD and was reached on Dec 7, 2022. View more price dynamics on SOFI chart.
See other stocks reaching their highest and lowest prices.
See other stocks reaching their highest and lowest prices.
SOFI stock is 2.17% volatile and has beta coefficient of 2.50. Track SoFi Technologies, Inc. stock price on the chart and check out the list of the most volatile stocks — is SoFi Technologies, Inc. there?
Today SoFi Technologies, Inc. has the market capitalization of 23.43 B, it has increased by 4.20% over the last week.
Yes, you can track SoFi Technologies, Inc. financials in yearly and quarterly reports right on TradingView.
SoFi Technologies, Inc. is going to release the next earnings report on Jul 29, 2025. Keep track of upcoming events with our Earnings Calendar.
SOFI earnings for the last quarter are 0.06 USD per share, whereas the estimation was 0.03 USD resulting in a 84.00% surprise. The estimated earnings for the next quarter are 0.06 USD per share. See more details about SoFi Technologies, Inc. earnings.
SoFi Technologies, Inc. revenue for the last quarter amounts to 770.72 M USD, despite the estimated figure of 738.98 M USD. In the next quarter, revenue is expected to reach 804.23 M USD.
SOFI net income for the last quarter is 71.12 M USD, while the quarter before that showed 332.47 M USD of net income which accounts for −78.61% change. Track more SoFi Technologies, Inc. financial stats to get the full picture.
No, SOFI doesn't pay any dividends to its shareholders. But don't worry, we've prepared a list of high-dividend stocks for you.
As of Jul 28, 2025, the company has 5 K employees. See our rating of the largest employees — is SoFi Technologies, Inc. on this list?
EBITDA measures a company's operating performance, its growth signifies an improvement in the efficiency of a company. SoFi Technologies, Inc. EBITDA is 585.15 M USD, and current EBITDA margin is 16.72%. See more stats in SoFi Technologies, Inc. financial statements.
Like other stocks, SOFI shares are traded on stock exchanges, e.g. Nasdaq, Nyse, Euronext, and the easiest way to buy them is through an online stock broker. To do this, you need to open an account and follow a broker's procedures, then start trading. You can trade SoFi Technologies, Inc. stock right from TradingView charts — choose your broker and connect to your account.
Investing in stocks requires a comprehensive research: you should carefully study all the available data, e.g. company's financials, related news, and its technical analysis. So SoFi Technologies, Inc. technincal analysis shows the buy rating today, and its 1 week rating is buy. Since market conditions are prone to changes, it's worth looking a bit further into the future — according to the 1 month rating SoFi Technologies, Inc. stock shows the strong buy signal. See more of SoFi Technologies, Inc. technicals for a more comprehensive analysis.
If you're still not sure, try looking for inspiration in our curated watchlists.
If you're still not sure, try looking for inspiration in our curated watchlists.