BAJAJ FINANCE 's Key Resistance Zone This is 4 hour chart of BAJAJ FINANCE
BAJAJ FINANCE having good Resistance at 9800 and 10200 range.
If this level is sustain , then we may see lower prices in BAJAJ FINANCE.
Thank You !!
Next report date
—
Report period
—
EPS estimate
—
Revenue estimate
—
268.90 INR
166.38 B INR
697.25 B INR
281.45 M
About BAJAJ FINANCE LTD
Sector
Industry
CEO
Anup Kumar Saha
Website
Headquarters
Pune
Founded
1987
ISIN
INE296A01032
FIGI
BBG000DBN2T9
Bajaj Finance Ltd. operates as a non-banking financial company. It offers consumer finance, SME finance, commercial lending, and investment services. It operates through the India and Outside India geographical segments. The company was founded on March 25, 1987 and is headquartered in Pune, India.

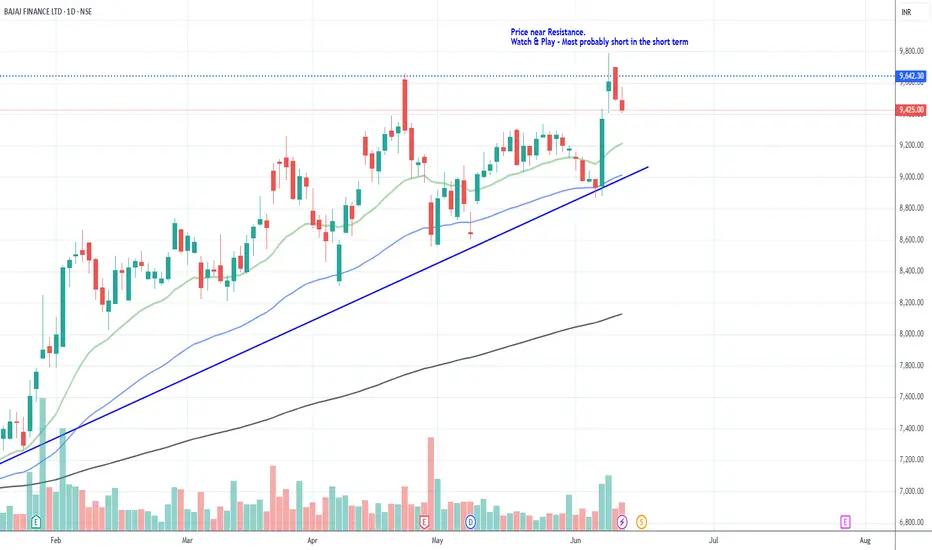
Bajaj Finance_Neutral to Short_Short termPrice near Resistance.
Watch & Play - Most probably short in the short term
#BAJFINANCE - Pivot is 9169.25 | Target 9732.25 or 8606.25?Date: 28-05-25
#BAJFINANCE - Pivot point is 9169.25
#BAJFINANCE Upside Targets:
Target 1: 9544.40
Target 2: 9732.25
Target 3: 9943.38
Target 4: 10154.50
#BAJFINANCE Downside Targets:
Target 1: 8794.80
Target 2: 8606.25
Target 3: 8395.13
Target 4: 8184.00
Support: 8983.36
Resistance: 9356.55


BAJAJ FINANCE is looking strong for the weekBAJAJ FINANCE is gearingup towords our target for coming week, it shows all retest and ready to blast, so lets see

12 monthCandles with a 12-month duration are uniquely crafted to burn slowly and steadily over the course of an entire year. These are not ordinary candles; they are long-lasting, high-quality pieces designed to serve both a functional and symbolic purpose. Often used in spiritual, religious, or ceremonial

Bajaj Finance Sell sideBaj finace sell side supply zone, breach main support , price going down, play with PUT option 8400 PE

Bajajfinance holding periods decades#bajfinance will break out of this two year triangle, has a huge potential for long run of becoming blue-chip stock,

See all ideas
Summarizing what the indicators are suggesting.
Neutral
SellBuy
Strong sellStrong buy
Strong sellSellNeutralBuyStrong buy
Neutral
SellBuy
Strong sellStrong buy
Strong sellSellNeutralBuyStrong buy
Neutral
SellBuy
Strong sellStrong buy
Strong sellSellNeutralBuyStrong buy
An aggregate view of professional's ratings.
Neutral
SellBuy
Strong sellStrong buy
Strong sellSellNeutralBuyStrong buy
Neutral
SellBuy
Strong sellStrong buy
Strong sellSellNeutralBuyStrong buy
Neutral
SellBuy
Strong sellStrong buy
Strong sellSellNeutralBuyStrong buy
Displays a symbol's price movements over previous years to identify recurring trends.
772BFL33
BFL-7.72%-23-5-33-PVTYield to maturity
7.60%
Maturity date
May 23, 2033
845BFL26
BFL-8.45%-29-9-26-PVTYield to maturity
7.43%
Maturity date
Sep 29, 2026
692BFL30
BFL-6.92%-24-12-30-PVTYield to maturity
6.96%
Maturity date
Dec 24, 2030
815BFL27
BFL-8.15%-22-6-27-PVTYield to maturity
6.85%
Maturity date
Jun 22, 2027
76BFL27
BFL-7.6%-25-08-27-PVTYield to maturity
6.39%
Maturity date
Aug 25, 2027
BFLZC26
BFL-ZC-18-2-26-PVTYield to maturity
−12.90%
Maturity date
Feb 18, 2026
810BFL32
BFL-8.10%-07-06-32-PVTYield to maturity
—
Maturity date
Jun 7, 2032
757BFL30
BFL-7.57%-03-04-30-PVTYield to maturity
—
Maturity date
Apr 3, 2030
865BFL26
BFL-8.64%-3-7-26-PVTYield to maturity
—
Maturity date
Jul 3, 2026
808BFL33
BFL-8.08%-21-3-33-PVTYield to maturity
—
Maturity date
Mar 21, 2033
795BFL27
BFL-7.95%-25-10-27-PVTYield to maturity
—
Maturity date
Oct 25, 2027
See all BAJFINANCE bonds
Curated watchlists where BAJFINANCE is featured.

Indian stocks: Racing ahead
46 No. of Symbols
See all sparks
Related stocks
Frequently Asked Questions
The current price of BAJFINANCE is 925.00 INR — it has decreased by −89.95% in the past 24 hours. Watch BAJAJ FINANCE LTD stock price performance more closely on the chart.
Depending on the exchange, the stock ticker may vary. For instance, on NSE exchange BAJAJ FINANCE LTD stocks are traded under the ticker BAJFINANCE.
BAJFINANCE stock has fallen by −90.18% compared to the previous week, the month change is a −89.80% fall, over the last year BAJAJ FINANCE LTD has showed a 26.78% increase.
We've gathered analysts' opinions on BAJAJ FINANCE LTD future price: according to them, BAJFINANCE price has a max estimate of 1,116.10 INR and a min estimate of 629.00 INR. Watch BAJFINANCE chart and read a more detailed BAJAJ FINANCE LTD stock forecast: see what analysts think of BAJAJ FINANCE LTD and suggest that you do with its stocks.
BAJFINANCE reached its all-time high on Jun 9, 2025 with the price of 9,788.00 INR, and its all-time low was 1.95 INR and was reached on Aug 18, 1998. View more price dynamics on BAJFINANCE chart.
See other stocks reaching their highest and lowest prices.
See other stocks reaching their highest and lowest prices.
BAJFINANCE stock is 2.17% volatile and has beta coefficient of 0.97. Track BAJAJ FINANCE LTD stock price on the chart and check out the list of the most volatile stocks — is BAJAJ FINANCE LTD there?
Today BAJAJ FINANCE LTD has the market capitalization of 5.79 T, it has decreased by −0.39% over the last week.
Yes, you can track BAJAJ FINANCE LTD financials in yearly and quarterly reports right on TradingView.
BAJAJ FINANCE LTD is going to release the next earnings report on Jul 29, 2025. Keep track of upcoming events with our Earnings Calendar.
BAJFINANCE earnings for the last quarter are 7.27 INR per share, whereas the estimation was 7.36 INR resulting in a −1.18% surprise. The estimated earnings for the next quarter are 6.89 INR per share. See more details about BAJAJ FINANCE LTD earnings.
BAJFINANCE net income for the last quarter is 44.80 B INR, while the quarter before that showed 42.47 B INR of net income which accounts for 5.49% change. Track more BAJAJ FINANCE LTD financial stats to get the full picture.
Yes, BAJFINANCE dividends are paid annually. The last dividend per share was 44.00 INR. As of today, Dividend Yield (TTM)% is 0.47%. Tracking BAJAJ FINANCE LTD dividends might help you take more informed decisions.
BAJAJ FINANCE LTD dividend yield was 0.49% in 2024, and payout ratio reached 16.36%. The year before the numbers were 0.50% and 15.20% correspondingly. See high-dividend stocks and find more opportunities for your portfolio.
EBITDA measures a company's operating performance, its growth signifies an improvement in the efficiency of a company. BAJAJ FINANCE LTD EBITDA is 309.09 B INR, and current EBITDA margin is 44.33%. See more stats in BAJAJ FINANCE LTD financial statements.
Like other stocks, BAJFINANCE shares are traded on stock exchanges, e.g. Nasdaq, Nyse, Euronext, and the easiest way to buy them is through an online stock broker. To do this, you need to open an account and follow a broker's procedures, then start trading. You can trade BAJAJ FINANCE LTD stock right from TradingView charts — choose your broker and connect to your account.
Investing in stocks requires a comprehensive research: you should carefully study all the available data, e.g. company's financials, related news, and its technical analysis. So BAJAJ FINANCE LTD technincal analysis shows the buy rating today, and its 1 week rating is buy. Since market conditions are prone to changes, it's worth looking a bit further into the future — according to the 1 month rating BAJAJ FINANCE LTD stock shows the buy signal. See more of BAJAJ FINANCE LTD technicals for a more comprehensive analysis.
If you're still not sure, try looking for inspiration in our curated watchlists.
If you're still not sure, try looking for inspiration in our curated watchlists.