RCFRCF
watch above levels. green line is our entry, redline is our SL.
DISCLAIMER : I am NOT a SEBI registered advisor or a financial adviser. All the views are for educational purpose only.
4.39 INR
2.42 B INR
169.34 B INR
137.70 M
About RASHTRIYA CHEMICALS & FER
Sector
Industry
CEO
Shriniwas C. Mudgerikar
Website
Headquarters
Mumbai
Founded
1978
ISIN
INE027A01015
FIGI
BBG000CYJ3W9
Rashtriya Chemicals & Fertilizers Ltd. is an India based fertilizers manufacturing company. It operates through the following segments: Fertilizers, Industrial Chemicals, and Trading. The Fertilizers segment engages in the production and supply of various grades of fertilizers for agricultural use. The Industrial Chemicals segment engages in the production of various chemicals and supply to diverse industries. The Trading segment represents fertilizers imported / locally sourced and marketed for agricultural use. The company was founded on March 6, 1978 and is headquartered in Mumbai, India.
Related stocks

RCF Report
📆 Monthly Time Frame:
📍 Price Action: Price is currently at a major support zone.
🔄 Trend Analysis: Downtrend (Dow Theory) remains intact.
📉 Moving Average: Price is near the 50 EMA.
🔍 Analysis: Price is not strongly bearish but not yet bullish. This zone might indicate a potential trend reve

RCF testing support lineRCF is converging testing 2 trendline and can easily reach 149-147 and move up in near time

(RCF) is Poised for a Breakout: Watch These Key Levels!Rashtriya Chemicals & Fertilizers Ltd. (RCF) stock is showing promising technical setups as it consolidates near critical resistance. With strong price action and a trendline acting as support, the stage may be set for an upward breakout.
Key Levels and Setup
📈 Support Trendline: The stock has cons

A look at RCF..A look at RCF..
SL 150
Target 194, 240
Stock following channel
Double bottom on daily TF
Goverement might be pushing for fertilizer consumptions (in next budget, market already assuming same.)


RCF looks good for 240++Seems like stock got support at 215 levels
can bounce back to resistance area240
target 240++
stoploss 200
vol avg now
needs a good volume for rally(expects)
agro chem theme
Rashtriya Chemicals & Fertilizers is a public sector undertaking (PSU) with 75% stake owned by GOI. Company is engaged in m

SWING IDEA - RCFMACD Cross is in play.
Volume has increased a lot this week.
1Y Beta is @ 1.78, which is very good for this stock.
This week could be your Entry week if stock retest levels mentioned on chart. Good change it might too.
Overall looks good till Swing High.

RCF GIVES BRAKEOUT ON DAILY CHARTNSE:RCF
RCF GIVES BRAKEOUT ON DAILY CHART.
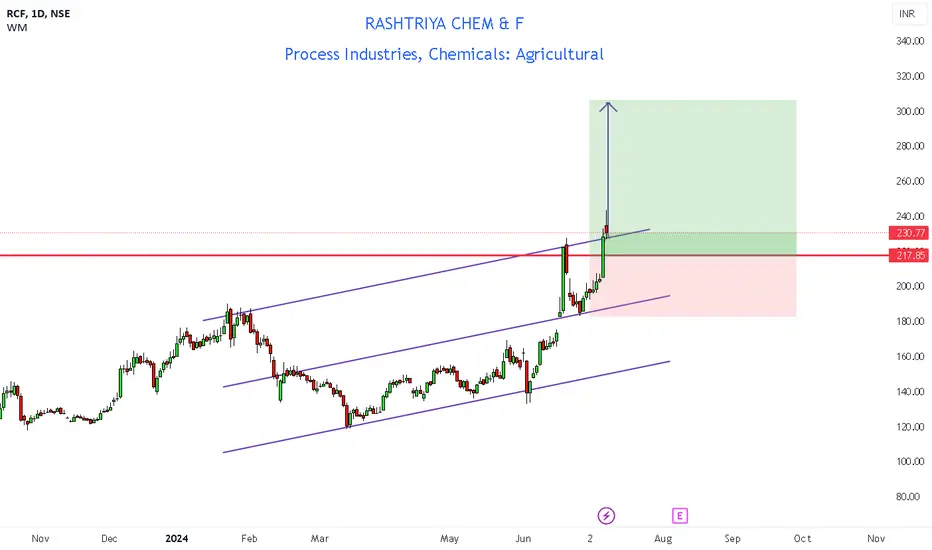
I am buying some quantity of Rcf on price 230 and i will bought some quantity on 218.
i will follow SL of 180
and i will set my target on 295,310.
i think in next 1 month i will get my targets.

See all ideas
Summarizing what the indicators are suggesting.
Oscillators
Neutral
SellBuy
Strong sellStrong buy
Strong sellSellNeutralBuyStrong buy
Oscillators
Neutral
SellBuy
Strong sellStrong buy
Strong sellSellNeutralBuyStrong buy
Summary
Neutral
SellBuy
Strong sellStrong buy
Strong sellSellNeutralBuyStrong buy
Summary
Neutral
SellBuy
Strong sellStrong buy
Strong sellSellNeutralBuyStrong buy
Summary
Neutral
SellBuy
Strong sellStrong buy
Strong sellSellNeutralBuyStrong buy
Moving Averages
Neutral
SellBuy
Strong sellStrong buy
Strong sellSellNeutralBuyStrong buy
Moving Averages
Neutral
SellBuy
Strong sellStrong buy
Strong sellSellNeutralBuyStrong buy
Displays a symbol's price movements over previous years to identify recurring trends.
749RCFL28
RCFL-7.49%-30-06-28-PVTYield to maturity
—
Maturity date
Jun 30, 2028
799RCFL27
RCFL-7.99%-7-8-27-PVTYield to maturity
—
Maturity date
Aug 7, 2027
See all RCF bonds
Frequently Asked Questions
The current price of RCF is 146.72 INR — it has decreased by −3.54% in the past 24 hours. Watch RASHTRIYA CHEMICALS & FER stock price performance more closely on the chart.
Depending on the exchange, the stock ticker may vary. For instance, on NSE exchange RASHTRIYA CHEMICALS & FER stocks are traded under the ticker RCF.
RCF stock has fallen by −5.36% compared to the previous week, the month change is a −6.21% fall, over the last year RASHTRIYA CHEMICALS & FER has showed a −27.72% decrease.
RCF stock is 2.85% volatile and has beta coefficient of 1.88. Track RASHTRIYA CHEMICALS & FER stock price on the chart and check out the list of the most volatile stocks — is RASHTRIYA CHEMICALS & FER there?
Today RASHTRIYA CHEMICALS & FER has the market capitalization of 82.92 B, it has increased by 2.08% over the last week.
Yes, you can track RASHTRIYA CHEMICALS & FER financials in yearly and quarterly reports right on TradingView.
RCF net income for the last quarter is 724.60 M INR, while the quarter before that showed 802.30 M INR of net income which accounts for −9.68% change. Track more RASHTRIYA CHEMICALS & FER financial stats to get the full picture.
Yes, RCF dividends are paid annually. The last dividend per share was 1.24 INR. As of today, Dividend Yield (TTM)% is 0.83%. Tracking RASHTRIYA CHEMICALS & FER dividends might help you take more informed decisions.
EBITDA measures a company's operating performance, its growth signifies an improvement in the efficiency of a company. RASHTRIYA CHEMICALS & FER EBITDA is 6.75 B INR, and current EBITDA margin is 3.98%. See more stats in RASHTRIYA CHEMICALS & FER financial statements.
Like other stocks, RCF shares are traded on stock exchanges, e.g. Nasdaq, Nyse, Euronext, and the easiest way to buy them is through an online stock broker. To do this, you need to open an account and follow a broker's procedures, then start trading. You can trade RASHTRIYA CHEMICALS & FER stock right from TradingView charts — choose your broker and connect to your account.
Investing in stocks requires a comprehensive research: you should carefully study all the available data, e.g. company's financials, related news, and its technical analysis. So RASHTRIYA CHEMICALS & FER technincal analysis shows the sell today, and its 1 week rating is sell. Since market conditions are prone to changes, it's worth looking a bit further into the future — according to the 1 month rating RASHTRIYA CHEMICALS & FER stock shows the neutral signal. See more of RASHTRIYA CHEMICALS & FER technicals for a more comprehensive analysis.
If you're still not sure, try looking for inspiration in our curated watchlists.
If you're still not sure, try looking for inspiration in our curated watchlists.