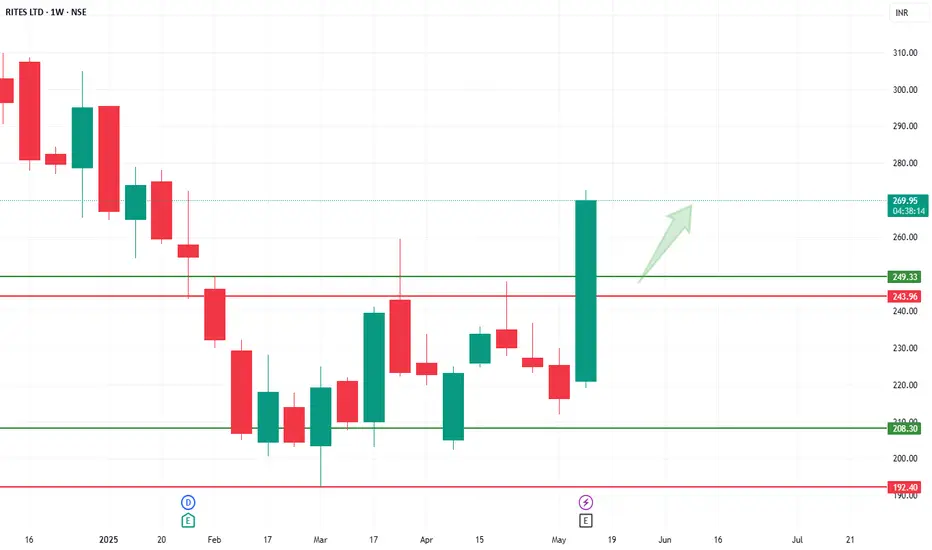
RITES - base formationRites is forming a base and expect an upward momentum. Strong fundamentals and technical added advantage. Keep a SL @ 285. R1 309 R2 315 R3 325.
Next report date
—
Report period
—
EPS estimate
—
Revenue estimate
—
8.00 INR
3.85 B INR
22.18 B INR
133.59 M
About RITES LTD
Sector
CEO
Rahul Mithal
Website
Headquarters
Gurgaon
Founded
1974
ISIN
INE320J01015
FIGI
BBG000VFHZN0
RITES Ltd. engages in the provision of transport infrastructural services. It operates through the following segments: Consultancy Services; Leasing of Railway Rolling Stock and Equipments; Export of Rolling Stock, Equipments and Spares; and Turnkey Construction Projects. The company was founded in 1974 and is headquartered in Gurgaon, India.
Related stocks

RITESRITES showing good strength in recent session. And currently trading near strong hurdle. It has a strong resistance near 310-15 levels and rejected many times earlier. So if now closing above 315 may start new momentum rally in the counter which may continue for next 20-22% upwards. On lower side 27

RITESRITES
watch above levels. green line is our entry, redline is our SL.
DISCLAIMER : I am NOT a SEBI registered advisor or a financial adviser. All the views are for educational purpose only.
RITES for Swing and Short Positional viewAs we can see H3 chart already has created reversal CHoCH which is a good signal of bullish view. After inducement (X) taken out candles have created M15 Ch and price is trading in the discount zone (<Rs 225/-) of previous impulsive leg (the low & high swing points already mentioned on the chart wi

RITES: INVERSE H&S BREAKOUTThe Inverse Head and Shoulders pattern is a bullish reversal chart pattern that signals a potential trend reversal from bearish to bullish. It consists of three key components:
Structure of the Pattern:
Left Shoulder: A price decline followed by a temporary rally.
Head: A deeper decline forming the

RITES giving bamboo to investorsRITES pays dividends, stock split etc.....but it has given major bamboo to its investors after the major run up...The most likely reversal area is around 150-160....provided we see some price action there....I wouldn't have much hope unless the overall Indian market sentiment improves.. Why can't th

Rites BO after accumulationThe stock is showing a breakout (Bo) after accumulating at support levels.
This presents a favorable risk-reward ratio (R:R) for trading, especially with a small stop loss (SL).
Volumes are also shooting 'up.
It's worth noting that there’s a trendline that has been respected for a long time.
Breakou

RITES LTDAnalyst consensus provides a median price target of ₹325.50, representing a potential upside of about 16.52% from the current price.
TRENDLYNE
In terms of valuation metrics, the company has a Price-to-Earnings (P/E) ratio of 33.81, a Price-to-Sales (P/S) ratio of 6.51, and a Price-to-Book (P/B) ra

SWING IDEA - RITESRITES , a leading engineering consultancy company specializing in transport infrastructure, is showing technical signals that suggest a promising swing trading opportunity.
Reasons are listed below :
770-800 Resistance Zone : The 770-800 level has been tested multiple times and the price is now

RITES GIVES BRAKEOUT ON DAILY CHARTNSE:RITES
RITES gives brake out on daily chart.
I am buying this stock
Near 750
And follow sl on 660
My target will be 890
My risk reward ratio is 1:1.50
Return on capital 20%

See all ideas
Summarizing what the indicators are suggesting.
Neutral
SellBuy
Strong sellStrong buy
Strong sellSellNeutralBuyStrong buy
Neutral
SellBuy
Strong sellStrong buy
Strong sellSellNeutralBuyStrong buy
Neutral
SellBuy
Strong sellStrong buy
Strong sellSellNeutralBuyStrong buy
An aggregate view of professional's ratings.
Neutral
SellBuy
Strong sellStrong buy
Strong sellSellNeutralBuyStrong buy
Neutral
SellBuy
Strong sellStrong buy
Strong sellSellNeutralBuyStrong buy
Neutral
SellBuy
Strong sellStrong buy
Strong sellSellNeutralBuyStrong buy
Displays a symbol's price movements over previous years to identify recurring trends.
Frequently Asked Questions
The current price of RITES is 272.70 INR — it has decreased by −3.72% in the past 24 hours. Watch RITES LTD stock price performance more closely on the chart.
Depending on the exchange, the stock ticker may vary. For instance, on NSE exchange RITES LTD stocks are traded under the ticker RITES.
RITES stock has fallen by −11.31% compared to the previous week, the month change is a −8.67% fall, over the last year RITES LTD has showed a −21.64% decrease.
We've gathered analysts' opinions on RITES LTD future price: according to them, RITES price has a max estimate of 335.00 INR and a min estimate of 259.00 INR. Watch RITES chart and read a more detailed RITES LTD stock forecast: see what analysts think of RITES LTD and suggest that you do with its stocks.
RITES reached its all-time high on Feb 27, 2024 with the price of 413.00 INR, and its all-time low was 76.00 INR and was reached on Jul 2, 2018. View more price dynamics on RITES chart.
See other stocks reaching their highest and lowest prices.
See other stocks reaching their highest and lowest prices.
RITES stock is 2.57% volatile and has beta coefficient of 2.29. Track RITES LTD stock price on the chart and check out the list of the most volatile stocks — is RITES LTD there?
Today RITES LTD has the market capitalization of 130.08 B, it has decreased by −6.75% over the last week.
Yes, you can track RITES LTD financials in yearly and quarterly reports right on TradingView.
RITES LTD is going to release the next earnings report on Aug 19, 2025. Keep track of upcoming events with our Earnings Calendar.
RITES earnings for the last quarter are 2.80 INR per share, whereas the estimation was 2.40 INR resulting in a 16.67% surprise. The estimated earnings for the next quarter are 1.60 INR per share. See more details about RITES LTD earnings.
RITES LTD revenue for the last quarter amounts to 6.15 B INR, despite the estimated figure of 5.99 B INR. In the next quarter, revenue is expected to reach 5.22 B INR.
RITES net income for the last quarter is 1.33 B INR, while the quarter before that showed 1.00 B INR of net income which accounts for 32.59% change. Track more RITES LTD financial stats to get the full picture.
EBITDA measures a company's operating performance, its growth signifies an improvement in the efficiency of a company. RITES LTD EBITDA is 5.15 B INR, and current EBITDA margin is 23.22%. See more stats in RITES LTD financial statements.
Like other stocks, RITES shares are traded on stock exchanges, e.g. Nasdaq, Nyse, Euronext, and the easiest way to buy them is through an online stock broker. To do this, you need to open an account and follow a broker's procedures, then start trading. You can trade RITES LTD stock right from TradingView charts — choose your broker and connect to your account.
Investing in stocks requires a comprehensive research: you should carefully study all the available data, e.g. company's financials, related news, and its technical analysis. So RITES LTD technincal analysis shows the neutral today, and its 1 week rating is buy. Since market conditions are prone to changes, it's worth looking a bit further into the future — according to the 1 month rating RITES LTD stock shows the buy signal. See more of RITES LTD technicals for a more comprehensive analysis.
If you're still not sure, try looking for inspiration in our curated watchlists.
If you're still not sure, try looking for inspiration in our curated watchlists.