STAR Health: Building Strength Quietly?STAR Health has shown a clear Wave (2) bottom and now appears to be in early stages of Wave (3). Price recently bounced from the 50–61.8% Fibonacci zone, retesting volume-supported levels around ₹425–₹430.
If this impulse unfolds cleanly, bullish targets lie ahead:
• Short-term: 506
• Extension: 56
Next report date
—
Report period
—
EPS estimate
—
Revenue estimate
—
10.05 INR
6.46 B INR
161.12 B INR
242.03 M
About STAR HEALTH & AL INS CO L
Sector
Industry
CEO
Anand Shankar Roy
Website
Headquarters
Chennai
Founded
2005
ISIN
INE575P01011
FIGI
BBG013QR5963
Star Health & Allied Insurance Co. Ltd. engages in the provision of health insurance services. It focuses on non-life insurance business in India. The company was founded by Venkatasamy Jagannathan on June 17, 2005 and is headquartered in Chennai, India.
Related stocks

$starhealth& al inshola,
33% in a month not bad was bound to reverse since the numbers are good for this ..
expected the rejection here at the bold thick white line
rsi topped up curling down so expect it to retrace then go for resistance 2 more times before going mental August onwards maybe not.. but hey time fo

$starhealthandinsurancelooks like the entire nifty is setting up for q3 fireworks
not sure how the summer will play out but for now i recon this reversal is confirmed with the impulsive move from the lows after seller exhaustion
am in from above but have patience not sure how far this runs but good high hopes from it
$starhealth&alliedinsurancedeviation below range low
bleeding for almost 3 years
rsi is about to get above the mid band the price should follow
resulting in a reclaim of previous range low and a run to range high where am leaning toward a break out to the blue line at least
not in this currently just pursuing for the m


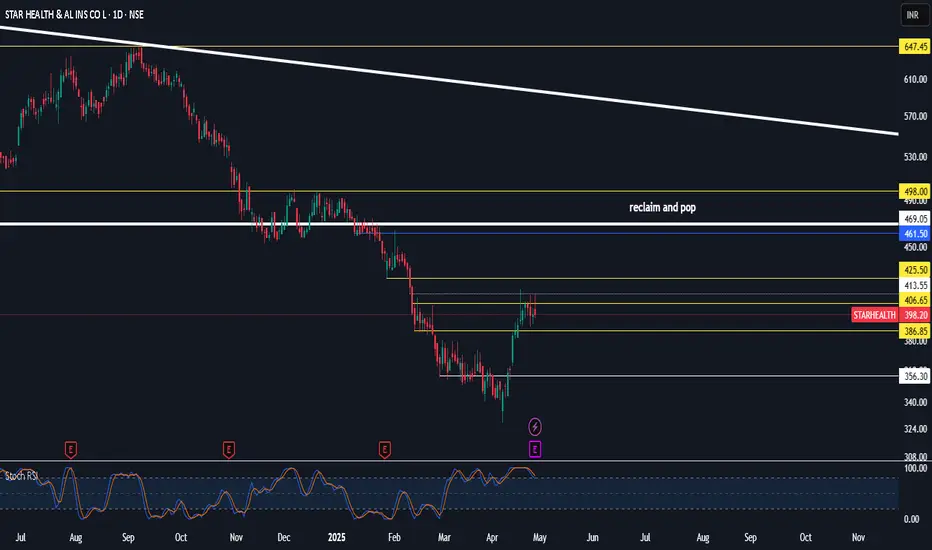
Star Health: Trendline Breakout Signals Bullish ReversalStar Health is showing promising signs for long-term holding.
The chart shows a clear downward sloping trendline that has been respected for a considerable period. Recently, the price has broken above this trendline, indicating potential trend reversal from bearish to bullish.
The immediate swin

STARHEALTHStar health has breakout major trend line and resistance Target are mention in the chart and this is only for educational purpose

STARHEALTHStar health has breakout major trend line and resistance Target are mention in the chart and this is only for educational purpose

STAR HEALTH READY TO ROCKSTAR HEALTH can double from here with in few years. Sl below the trend line.
Chart is self explanatory. Please follow the price action & take the trade as per your appetite.
The information provided here is only for educational purpose. The information provided here is not intended to be any kind

swing pick - buy at zonethis zone marked is potential reversal zone . expecting reversal from that zone.buyers can look for buying confirmation inside the zone.
-- for target , mark fib retracement on C to latest swing low and keep 0.5 fib value as tgt.
-- sl is candle close below zone
-- if candle closed below this zone

See all ideas
Summarizing what the indicators are suggesting.
Neutral
SellBuy
Strong sellStrong buy
Strong sellSellNeutralBuyStrong buy
Neutral
SellBuy
Strong sellStrong buy
Strong sellSellNeutralBuyStrong buy
Neutral
SellBuy
Strong sellStrong buy
Strong sellSellNeutralBuyStrong buy
An aggregate view of professional's ratings.
Neutral
SellBuy
Strong sellStrong buy
Strong sellSellNeutralBuyStrong buy
Neutral
SellBuy
Strong sellStrong buy
Strong sellSellNeutralBuyStrong buy
Neutral
SellBuy
Strong sellStrong buy
Strong sellSellNeutralBuyStrong buy
Displays a symbol's price movements over previous years to identify recurring trends.
Frequently Asked Questions
The current price of STARHEALTH is 431.80 INR — it has decreased by −0.06% in the past 24 hours. Watch STAR HEALTH & AL INS CO L stock price performance more closely on the chart.
Depending on the exchange, the stock ticker may vary. For instance, on NSE exchange STAR HEALTH & AL INS CO L stocks are traded under the ticker STARHEALTH.
STARHEALTH stock has risen by 2.87% compared to the previous week, the month change is a 3.93% rise, over the last year STAR HEALTH & AL INS CO L has showed a −25.67% decrease.
We've gathered analysts' opinions on STAR HEALTH & AL INS CO L future price: according to them, STARHEALTH price has a max estimate of 540.00 INR and a min estimate of 380.00 INR. Watch STARHEALTH chart and read a more detailed STAR HEALTH & AL INS CO L stock forecast: see what analysts think of STAR HEALTH & AL INS CO L and suggest that you do with its stocks.
STARHEALTH reached its all-time high on Dec 10, 2021 with the price of 940.00 INR, and its all-time low was 327.30 INR and was reached on Apr 7, 2025. View more price dynamics on STARHEALTH chart.
See other stocks reaching their highest and lowest prices.
See other stocks reaching their highest and lowest prices.
STARHEALTH stock is 2.30% volatile and has beta coefficient of 0.98. Track STAR HEALTH & AL INS CO L stock price on the chart and check out the list of the most volatile stocks — is STAR HEALTH & AL INS CO L there?
Today STAR HEALTH & AL INS CO L has the market capitalization of 256.12 B, it has increased by 2.90% over the last week.
Yes, you can track STAR HEALTH & AL INS CO L financials in yearly and quarterly reports right on TradingView.
STAR HEALTH & AL INS CO L is going to release the next earnings report on Nov 4, 2025. Keep track of upcoming events with our Earnings Calendar.
STARHEALTH earnings for the last quarter are 4.49 INR per share, whereas the estimation was 5.87 INR resulting in a −23.48% surprise. The estimated earnings for the next quarter are 2.10 INR per share. See more details about STAR HEALTH & AL INS CO L earnings.
STARHEALTH net income for the last quarter is 2.63 B INR, while the quarter before that showed 5.10 M INR of net income which accounts for 51.37 K% change. Track more STAR HEALTH & AL INS CO L financial stats to get the full picture.
No, STARHEALTH doesn't pay any dividends to its shareholders. But don't worry, we've prepared a list of high-dividend stocks for you.
Like other stocks, STARHEALTH shares are traded on stock exchanges, e.g. Nasdaq, Nyse, Euronext, and the easiest way to buy them is through an online stock broker. To do this, you need to open an account and follow a broker's procedures, then start trading. You can trade STAR HEALTH & AL INS CO L stock right from TradingView charts — choose your broker and connect to your account.
Investing in stocks requires a comprehensive research: you should carefully study all the available data, e.g. company's financials, related news, and its technical analysis. So STAR HEALTH & AL INS CO L technincal analysis shows the sell today, and its 1 week rating is sell. Since market conditions are prone to changes, it's worth looking a bit further into the future — according to the 1 month rating STAR HEALTH & AL INS CO L stock shows the sell signal. See more of STAR HEALTH & AL INS CO L technicals for a more comprehensive analysis.
If you're still not sure, try looking for inspiration in our curated watchlists.
If you're still not sure, try looking for inspiration in our curated watchlists.