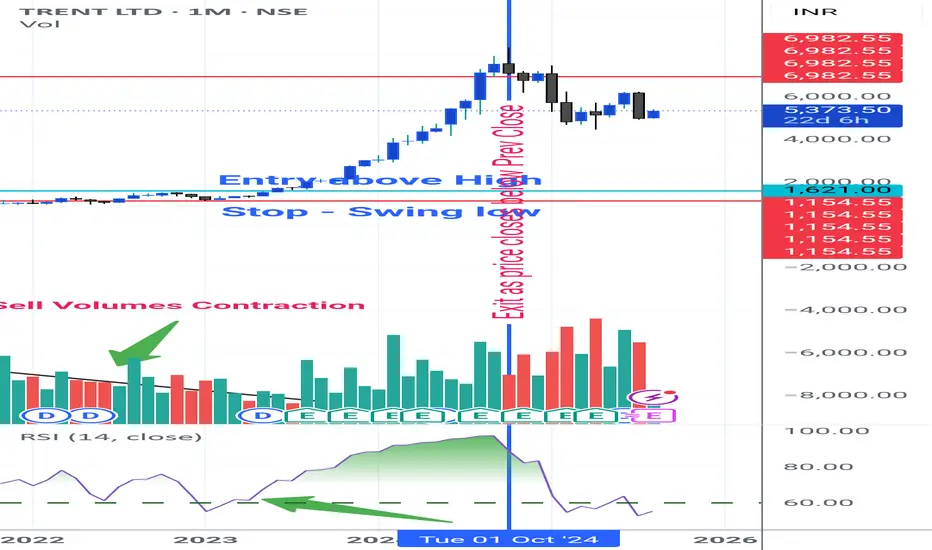
Swing & Positional Trading & Stock Options - High Beta Momentum This trading guide outlines a simple and effective setup for both positional and swing trades, focused on high beta, highly liquid stocks. Follow the rules strictly for better consistency and profitability.
🔹 Positional Trade Setup
• Open the Monthly Chart of the stock.
• Add the RSI (Relat
Next report date
—
Report period
—
EPS estimate
—
Revenue estimate
—
44.55 INR
15.47 B INR
171.09 B INR
195.12 M
About TRENT LTD
Sector
Industry
CEO
Venkatesalu Palaniswamy
Website
Headquarters
Mumbai
Founded
1952
ISIN
INE849A01020
FIGI
BBG000CVJMW3
Trent Ltd. engages in the chain of retail stores under the Westside brand in India. Its Westside department stores provide women's wear, men's wear, kids' wear, footwear, lingerie, cosmetics, perfumes and handbags, household furniture, and accessories. The firm also operates a hypermarket and convenience stores under the Star brand, which offers staple foods, beverages, health and beauty products, vegetables, fruits, dairy and non-vegetarian products, apparel, and home furnishings. In addition, it operates books and music retail chains under the Landmark name that provides toys, adult and young adult books, sports-related merchandise, tech accessories, and gaming and stationery products. It operates 108 Westside stores and 5 independent Landmark stores, as well as 42 stores under Star Daily. The company was founded in 1952 and is headquartered in Mumbai, India.
Related stocks
TRENT: TR-ENDMcap Rs 220,000 cr
Growth: What Growth !!
EPS peaked in March 24, ( 5 quarters back)
PER 150 ( on latest ann EPS)
Only 3 out of 24 analysts on the Dalal Street are Bearish, more would realise the mistake very soon.

Trent showing BreakoutNSE:TRENT showing breakout with Ascending Traingle. You can enter at the current Point . 1st target would be 6130, Second Target would be 6260. Keep the Stoploss at 5650. One who is trying for Second target , try to achieve the same by Trailing stoploss.
Note : Considering the Ongoing Isreal - I

Review and plan for 1st July 2025Nifty future and banknifty future analysis and intraday plan.
swing idea - trent
This video is for information/education purpose only. you are 100% responsible for any actions you take by reading/viewing this post.
please consult your financial advisor before taking any action.
----Vinaykumar


Trent on a bull mode?Broken 100ema and retested on 10ema and bounced with a big candle..
missed bottom pick..seems little more steam left.
6500 Target1..7k Target2
exit below 5900.
Slowly going up so need patience to hold..
part of tata group.
Trent Ltd is engaged in retailing of apparels, footwear, accessories, toys,

Ye Chart Kuch Kehta Hai : Trent LtdTrent India Limited is attractive for mid to long-term investment because it combines strong financial performance, aggressive growth plans (especially through Zudio), a diversified retail portfolio, and solid backing from the Tata Group. The company is positioned well to capitalize on the growing I

Trent Ltd: Breakout or Fakeout?Trent Ltd: Breakout or Fakeout? Someone’s positioning — the question is which side.
Trent Ltd remains one of the more resilient players in India’s retail landscape. While broader consumer sentiment remains mixed, the company continues expanding its footprint, especially through its Westside stores

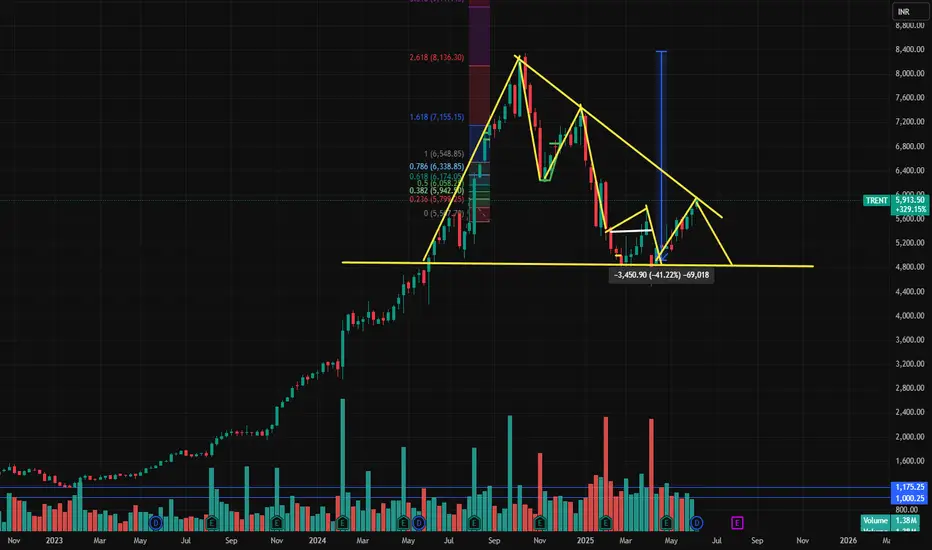
TRENT Weekly Chart-After a massive 41% correction, the stock is showing signs of reversal with a strong W-pattern and falling wedge breakout attempt.
Watch ₹6,000 closely — a breakout above could trigger fresh momentum toward ₹6,500 and beyond.
₹4,800 remains a critical support to protect.
Volume buildup will be key f
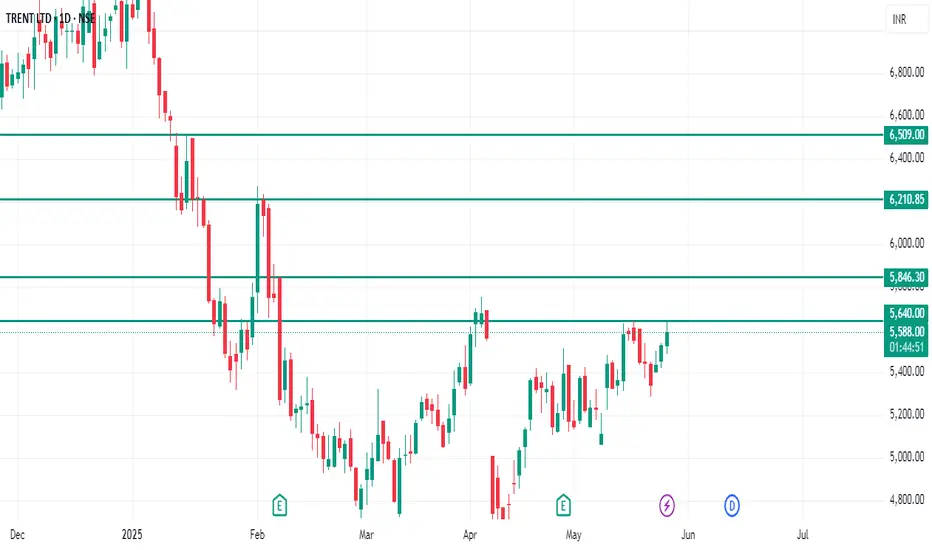
Go long in TRENT Go long in TRENT only if it's manage to close above 5640 on daily frame. On the upside, we can expect targets of 5845, 6210 & 6500.
See all ideas
Summarizing what the indicators are suggesting.
Neutral
SellBuy
Strong sellStrong buy
Strong sellSellNeutralBuyStrong buy
Neutral
SellBuy
Strong sellStrong buy
Strong sellSellNeutralBuyStrong buy
Neutral
SellBuy
Strong sellStrong buy
Strong sellSellNeutralBuyStrong buy
An aggregate view of professional's ratings.
Neutral
SellBuy
Strong sellStrong buy
Strong sellSellNeutralBuyStrong buy
Neutral
SellBuy
Strong sellStrong buy
Strong sellSellNeutralBuyStrong buy
Neutral
SellBuy
Strong sellStrong buy
Strong sellSellNeutralBuyStrong buy
Displays a symbol's price movements over previous years to identify recurring trends.
Frequently Asked Questions
The current price of TRENT is 5,443.50 INR — it has increased by 2.53% in the past 24 hours. Watch TRENT LTD stock price performance more closely on the chart.
Depending on the exchange, the stock ticker may vary. For instance, on NSE exchange TRENT LTD stocks are traded under the ticker TRENT.
TRENT stock has risen by 3.35% compared to the previous week, the month change is a 0.60% rise, over the last year TRENT LTD has showed a −5.15% decrease.
We've gathered analysts' opinions on TRENT LTD future price: according to them, TRENT price has a max estimate of 7,200.00 INR and a min estimate of 4,275.00 INR. Watch TRENT chart and read a more detailed TRENT LTD stock forecast: see what analysts think of TRENT LTD and suggest that you do with its stocks.
TRENT reached its all-time high on Oct 14, 2024 with the price of 8,345.00 INR, and its all-time low was 23.65 INR and was reached on Nov 19, 2008. View more price dynamics on TRENT chart.
See other stocks reaching their highest and lowest prices.
See other stocks reaching their highest and lowest prices.
TRENT stock is 3.40% volatile and has beta coefficient of 1.40. Track TRENT LTD stock price on the chart and check out the list of the most volatile stocks — is TRENT LTD there?
Today TRENT LTD has the market capitalization of 1.89 T, it has increased by 2.32% over the last week.
Yes, you can track TRENT LTD financials in yearly and quarterly reports right on TradingView.
TRENT LTD is going to release the next earnings report on Nov 6, 2025. Keep track of upcoming events with our Earnings Calendar.
TRENT earnings for the last quarter are 11.90 INR per share, whereas the estimation was 11.51 INR resulting in a 3.43% surprise. The estimated earnings for the next quarter are 14.29 INR per share. See more details about TRENT LTD earnings.
TRENT LTD revenue for the last quarter amounts to 47.81 B INR, despite the estimated figure of 48.08 B INR. In the next quarter, revenue is expected to reach 51.81 B INR.
TRENT net income for the last quarter is 4.30 B INR, while the quarter before that showed 3.18 B INR of net income which accounts for 35.06% change. Track more TRENT LTD financial stats to get the full picture.
Yes, TRENT dividends are paid annually. The last dividend per share was 5.00 INR. As of today, Dividend Yield (TTM)% is 0.09%. Tracking TRENT LTD dividends might help you take more informed decisions.
TRENT LTD dividend yield was 0.09% in 2024, and payout ratio reached 11.49%. The year before the numbers were 0.08% and 7.65% correspondingly. See high-dividend stocks and find more opportunities for your portfolio.
As of Aug 11, 2025, the company has 27.89 K employees. See our rating of the largest employees — is TRENT LTD on this list?
EBITDA measures a company's operating performance, its growth signifies an improvement in the efficiency of a company. TRENT LTD EBITDA is 29.85 B INR, and current EBITDA margin is 16.41%. See more stats in TRENT LTD financial statements.
Like other stocks, TRENT shares are traded on stock exchanges, e.g. Nasdaq, Nyse, Euronext, and the easiest way to buy them is through an online stock broker. To do this, you need to open an account and follow a broker's procedures, then start trading. You can trade TRENT LTD stock right from TradingView charts — choose your broker and connect to your account.
Investing in stocks requires a comprehensive research: you should carefully study all the available data, e.g. company's financials, related news, and its technical analysis. So TRENT LTD technincal analysis shows the buy rating today, and its 1 week rating is buy. Since market conditions are prone to changes, it's worth looking a bit further into the future — according to the 1 month rating TRENT LTD stock shows the buy signal. See more of TRENT LTD technicals for a more comprehensive analysis.
If you're still not sure, try looking for inspiration in our curated watchlists.
If you're still not sure, try looking for inspiration in our curated watchlists.