AMCR - KEEPING MY EYE ON THIS ONE.Good Morning,
AMCR looks like it is ramping up for a good buy. We saw significant buying action at the 8.90$-9.20$ levels to create a support. Price point was quickly rejected at 9.40$ on the short term.
I am looking to see how AMCR fairs again at the 9.20$ level. This would signify a move upward
Next report date
—
Report period
—
EPS estimate
—
Revenue estimate
—
0.56 USD
730.00 M USD
13.64 B USD
2.30 B
About Amcor plc
Sector
Industry
CEO
Peter Konieczny
Website
Headquarters
Zurich
Founded
2018
ISIN
JE00BJ1F3079
FIGI
BBG00LNJRQ09
Amcor Plc operates as a holding company, which engages in the provision of consumer packaging business. It operates through the Flexibles and Rigid Packaging segments. The Flexibles segment develops and supplies flexible packaging globally. The Rigid Plastics segment manufactures rigid plastic containers and related products. The company was founded in 1926 and is headquartered in Zurich, Switzerland.
Related stocks

Has the local bottom formed?Making the case for a bottom being complete at this level. There will be a retest of the bottom but my thesis is that it should hold above $8.37.
There are a few items for my thesis. One, there is a Bullish Divergence on the weekly time frame. Two, Accumulation/Distribution is still holding well,

#AMCR - $13-$16- another nice 5:1 setup
- strong bridge breach
- potential $13
- long term - target line

Potential outside week and bullish potential for AMCEntry conditions:
(i) higher share price for ASX:AMC above the level of the potential outside week noted on 23-Aug.
Stop loss for the trade would be:
(i) below the swing low of 19th August (i.e.: below $15.53), once the trade has activated.

AMC.ASX: 16 JULY, 2024© Master of Elliott Wave Analysis: Hua (Shane) Cuong, CEWA-M (Master's Designation).
Forecast: Bullish
Details: Wave 2-grey has just bottomed at the low of 14.10, wave 3-grey is opening, to push higher.
Invalidation point: 14.10


$AMCR with a bearish outlook following its earnings #StocksThe PEAD projected a bearish outlook for $AMCR after a negative under reaction following its earnings release placing the stock in drift D with an expected accuracy of 50%.


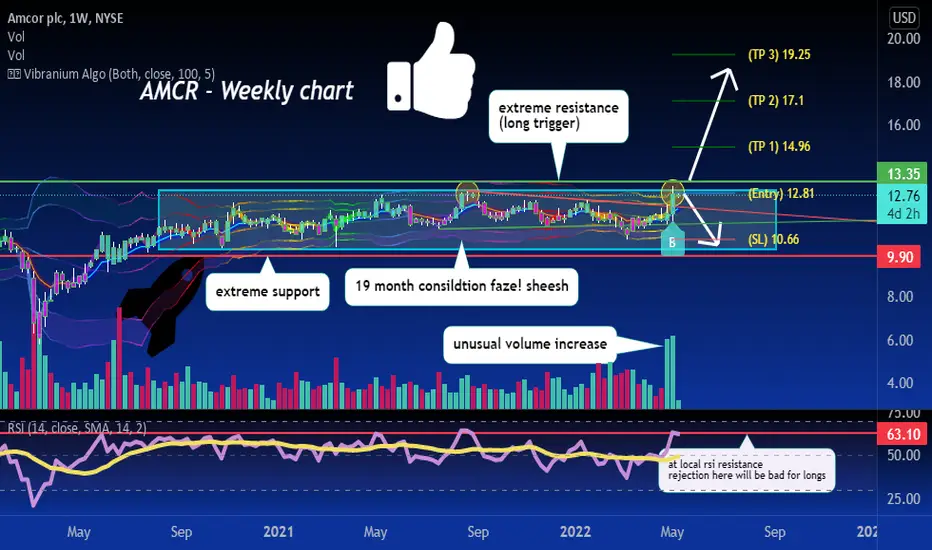
AMCR on the verge of breaking 19 month consolidation?you guys know my motto, after huge consolidation or downtrend we will see big breakouts in either direction!
a rejection at extreme resistance and a test 10-11 support is likely
Amcor Strong Breakout AMCRA strong Fibonacci circle trend line can be drawn, this is validated by the bottom along 4.618
Another trendline can be drawn along a down period that has been broken out of and under an attempt to move out of 1.618
Very bullish

See all ideas
Summarizing what the indicators are suggesting.
Neutral
SellBuy
Strong sellStrong buy
Strong sellSellNeutralBuyStrong buy
Neutral
SellBuy
Strong sellStrong buy
Strong sellSellNeutralBuyStrong buy
Neutral
SellBuy
Strong sellStrong buy
Strong sellSellNeutralBuyStrong buy
An aggregate view of professional's ratings.
Neutral
SellBuy
Strong sellStrong buy
Strong sellSellNeutralBuyStrong buy
Neutral
SellBuy
Strong sellStrong buy
Strong sellSellNeutralBuyStrong buy
Neutral
SellBuy
Strong sellStrong buy
Strong sellSellNeutralBuyStrong buy
Displays a symbol's price movements over previous years to identify recurring trends.
AMCR4402225
Bemis Company, Inc. 3.1% 15-SEP-2026Yield to maturity
7.02%
Maturity date
Sep 15, 2026
APO5562970
Berry Global, Inc. 5.5% 15-APR-2028Yield to maturity
6.30%
Maturity date
Apr 15, 2028
APO5811523
Berry Global, Inc. 5.8% 15-JUN-2031Yield to maturity
5.88%
Maturity date
Jun 15, 2031
APO5732723
Berry Global, Inc. 5.65% 15-JAN-2034Yield to maturity
5.47%
Maturity date
Jan 15, 2034
AMCR6028685
Amcor Flexibles North America, Inc. 5.5% 17-MAR-2035Yield to maturity
5.43%
Maturity date
Mar 17, 2035
APO4836488
Berry Global, Inc. 4.875% 15-JUL-2026Yield to maturity
5.09%
Maturity date
Jul 15, 2026
APO6009079
Berry Global, Inc. 5.65% 15-JAN-2034Yield to maturity
5.08%
Maturity date
Jan 15, 2034
AMCR5187505
Amcor Flexibles North America, Inc. 2.69% 25-MAY-2031Yield to maturity
5.02%
Maturity date
May 25, 2031
AMCR5589366
Amcor Finance (USA), Inc. 5.625% 26-MAY-2033Yield to maturity
4.96%
Maturity date
May 26, 2033
USU0741BAA4
BERRY GLOBAL 24/31 REGSYield to maturity
4.96%
Maturity date
Jun 15, 2031
APO5288911
Berry Global, Inc. 1.57% 15-JAN-2026Yield to maturity
4.89%
Maturity date
Jan 15, 2026
See all AMCR bonds
Frequently Asked Questions
The current price of AMCR is 9.63 USD — it has decreased by −0.62% in the past 24 hours. Watch Amcor plc stock price performance more closely on the chart.
Depending on the exchange, the stock ticker may vary. For instance, on NYSE exchange Amcor plc stocks are traded under the ticker AMCR.
AMCR stock has risen by 4.22% compared to the previous week, the month change is a 6.88% rise, over the last year Amcor plc has showed a 0.10% increase.
We've gathered analysts' opinions on Amcor plc future price: according to them, AMCR price has a max estimate of 13.00 USD and a min estimate of 8.94 USD. Watch AMCR chart and read a more detailed Amcor plc stock forecast: see what analysts think of Amcor plc and suggest that you do with its stocks.
AMCR reached its all-time high on Jun 6, 2022 with the price of 13.61 USD, and its all-time low was 5.80 USD and was reached on Mar 16, 2020. View more price dynamics on AMCR chart.
See other stocks reaching their highest and lowest prices.
See other stocks reaching their highest and lowest prices.
AMCR stock is 1.04% volatile and has beta coefficient of 0.38. Track Amcor plc stock price on the chart and check out the list of the most volatile stocks — is Amcor plc there?
Today Amcor plc has the market capitalization of 22.20 B, it has decreased by −2.39% over the last week.
Yes, you can track Amcor plc financials in yearly and quarterly reports right on TradingView.
Amcor plc is going to release the next earnings report on Aug 13, 2025. Keep track of upcoming events with our Earnings Calendar.
AMCR earnings for the last quarter are 0.18 USD per share, whereas the estimation was 0.18 USD resulting in a −2.69% surprise. The estimated earnings for the next quarter are 0.22 USD per share. See more details about Amcor plc earnings.
Amcor plc revenue for the last quarter amounts to 3.33 B USD, despite the estimated figure of 3.47 B USD. In the next quarter, revenue is expected to reach 5.18 B USD.
AMCR net income for the last quarter is 196.00 M USD, while the quarter before that showed 163.00 M USD of net income which accounts for 20.25% change. Track more Amcor plc financial stats to get the full picture.
Yes, AMCR dividends are paid quarterly. The last dividend per share was 0.13 USD. As of today, Dividend Yield (TTM)% is 5.27%. Tracking Amcor plc dividends might help you take more informed decisions.
Amcor plc dividend yield was 5.09% in 2024, and payout ratio reached 98.89%. The year before the numbers were 4.88% and 68.75% correspondingly. See high-dividend stocks and find more opportunities for your portfolio.
As of Jul 4, 2025, the company has 41 K employees. See our rating of the largest employees — is Amcor plc on this list?
EBITDA measures a company's operating performance, its growth signifies an improvement in the efficiency of a company. Amcor plc EBITDA is 1.89 B USD, and current EBITDA margin is 14.18%. See more stats in Amcor plc financial statements.
Like other stocks, AMCR shares are traded on stock exchanges, e.g. Nasdaq, Nyse, Euronext, and the easiest way to buy them is through an online stock broker. To do this, you need to open an account and follow a broker's procedures, then start trading. You can trade Amcor plc stock right from TradingView charts — choose your broker and connect to your account.
Investing in stocks requires a comprehensive research: you should carefully study all the available data, e.g. company's financials, related news, and its technical analysis. So Amcor plc technincal analysis shows the buy rating today, and its 1 week rating is buy. Since market conditions are prone to changes, it's worth looking a bit further into the future — according to the 1 month rating Amcor plc stock shows the sell signal. See more of Amcor plc technicals for a more comprehensive analysis.
If you're still not sure, try looking for inspiration in our curated watchlists.
If you're still not sure, try looking for inspiration in our curated watchlists.