John Deere position trade setupI have been wanting an excuse to add this to my portfolio for a while now. Primarily because Bill Gates has it in his portfolio. I like to try and copy the most successful investors like Warren Buffett, Cathy Wood, Bill Gates, etc... I paid the market price today for a position with a cost average o
Next report date
—
Report period
—
EPS estimate
—
Revenue estimate
—
20.74 USD
7.10 B USD
51.59 B USD
250.72 M
About Deere & Company
Sector
CEO
John C. May
Website
Headquarters
Moline
Founded
1837
FIGI
BBG000BH1NH9
Deere & Co. engages in the manufacture and distribution of equipment used in agriculture, construction, forestry, and turf care. It operates through the following segments: Agriculture and Turf, Construction and Forestry, and Financial Services. The Agriculture and Turf segment focuses on the distribution and manufacture of a full line of agriculture and turf equipment and related service parts. The Construction and Forestry segment offers machines and service parts used in construction, earthmoving, road building, material handling and timber harvesting. The Financial Services segment finances sales and leases by John Deere dealers of new and used agriculture and turf equipment and construction and forestry equipment. The company was founded by John Deere in 1837 and is headquartered in Moline, IL.
Related stocks
$DE DivergenceOn the monthly chart we see a massive bearish divergence on the movement of NYSE:DE and the squeeze indicator below. Keep in mind, this is a monthly chart, which means you have to remain patient.
Not financial advice, good luck to all

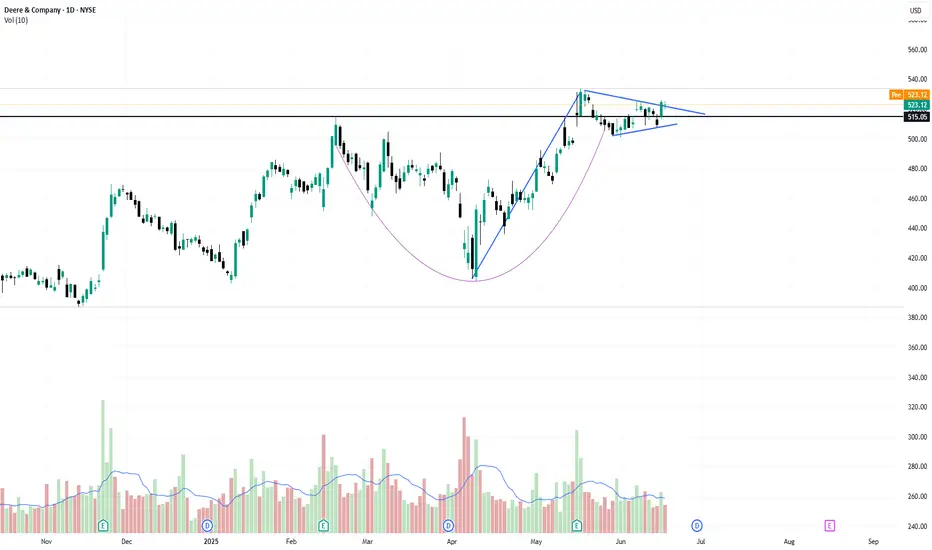
the wedge pattern breakout near ATHStock is outperforming the index and trading near its all-time high and forming a small wedge pattern, indicating consolidation before a potential breakout. A sustained move above $507.50 could trigger bullish momentum. Targeting $553 in the near term. Risk-reward remains favorable with strong price
Farming and construction equipment on Rise, DE has chanceDE might get chance in the recent reported boom of farming and construction equipment makers rise in the US.
DE is already on 2.2% rise as per Reuters.
Machinery are really affected by the volatility in the Tariff war, some time increasing and some time decreasing. Every business wants a secure s

[bear] a tight Deere short tradeimportant points:
entry: 461
SL: 476
TP1: 417-430
R:R: ~2.2-3.2
checklist:
- bulls underwater: check.
- bear market: check.
- stock floating near resistance: check.
- bearish engulfing w/ low volume days: check.
- fundamentals shitty: check.

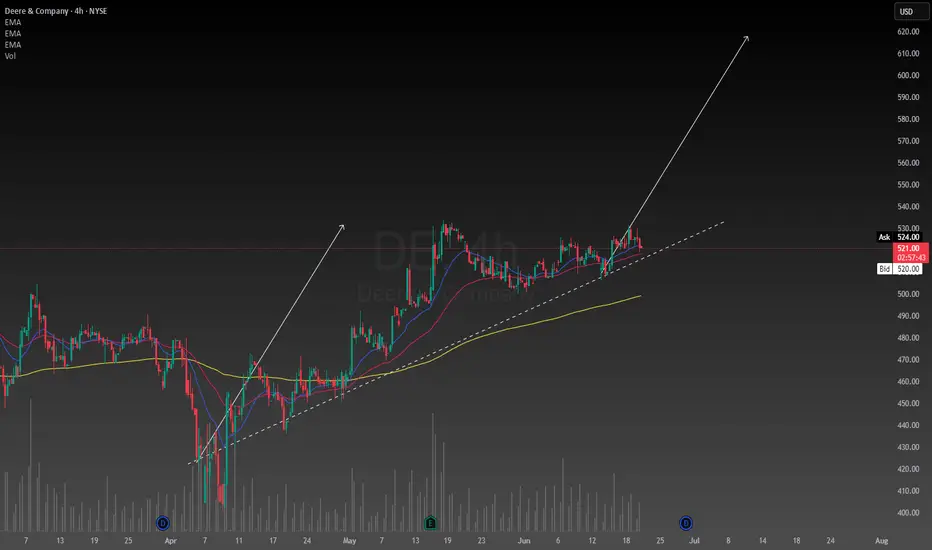
Deere to $600 next?As displayed on the graph. Deere seems to move away from an accumulation area. Next HTF area of interest seems to be around the $600 mark.

Down by $150According to the pattern, a picture emerges that we will fall to $ 150. I'll be watching

DE technical analysis 4HIf overall market continues to week, the price will surely comes to fill gap below at 438- 443( regular trading session)

$DE Breaking Out of Flat Base?I went long NYSE:DE on Mar 5th after it bounced right back over the 50 DMA (red). It had been choppy, so I waited to add to the position until today. Why today? If you look you can see the pattern of the candles kept getting tighter and consolidating around the shorter term EMAs. I had drawn in wh

$DE with a bullish outlook following its earnings #StocksThe PEAD projected a bullish outlook for NYSE:DE after a negative over reaction following its earnings release placing the stock in drift C with an expected accuracy of 28.57%.

See all ideas
Summarizing what the indicators are suggesting.
Neutral
SellBuy
Strong sellStrong buy
Strong sellSellNeutralBuyStrong buy
Neutral
SellBuy
Strong sellStrong buy
Strong sellSellNeutralBuyStrong buy
Neutral
SellBuy
Strong sellStrong buy
Strong sellSellNeutralBuyStrong buy
An aggregate view of professional's ratings.
Neutral
SellBuy
Strong sellStrong buy
Strong sellSellNeutralBuyStrong buy
Neutral
SellBuy
Strong sellStrong buy
Strong sellSellNeutralBuyStrong buy
Neutral
SellBuy
Strong sellStrong buy
Strong sellSellNeutralBuyStrong buy
Displays a symbol's price movements over previous years to identify recurring trends.
J
HJCFD
John Deere Credit Compania Financiera SA 5.0% 21-OCT-2026Yield to maturity
9.10%
Maturity date
Oct 21, 2026
J
HJCGD
John Deere Credit Compania Financiera SA 6.5% 21-OCT-2028Yield to maturity
7.63%
Maturity date
Oct 21, 2028
J
HJCHD
John Deere Credit Compania Financiera SA 7.0% 17-JAN-2028Yield to maturity
6.55%
Maturity date
Jan 17, 2028
J
DE5827563
John Deere Capital Corporation 5.05% 12-JUN-2034Yield to maturity
4.96%
Maturity date
Jun 12, 2034
J
DE5788969
John Deere Capital Corporation 5.1% 11-APR-2034Yield to maturity
4.92%
Maturity date
Apr 11, 2034
See all DE bonds
Curated watchlists where DE is featured.


Frequently Asked Questions
The current price of DE is 521.38 USD — it has decreased by −0.69% in the past 24 hours. Watch Deere & Company stock price performance more closely on the chart.
Depending on the exchange, the stock ticker may vary. For instance, on NYSE exchange Deere & Company stocks are traded under the ticker DE.
DE stock has risen by 1.63% compared to the previous week, the month change is a 0.35% rise, over the last year Deere & Company has showed a 36.58% increase.
We've gathered analysts' opinions on Deere & Company future price: according to them, DE price has a max estimate of 750.00 USD and a min estimate of 460.00 USD. Watch DE chart and read a more detailed Deere & Company stock forecast: see what analysts think of Deere & Company and suggest that you do with its stocks.
DE stock is 2.13% volatile and has beta coefficient of 0.94. Track Deere & Company stock price on the chart and check out the list of the most volatile stocks — is Deere & Company there?
Today Deere & Company has the market capitalization of 141.20 B, it has increased by 1.57% over the last week.
Yes, you can track Deere & Company financials in yearly and quarterly reports right on TradingView.
Deere & Company is going to release the next earnings report on Aug 15, 2025. Keep track of upcoming events with our Earnings Calendar.
DE earnings for the last quarter are 6.64 USD per share, whereas the estimation was 5.56 USD resulting in a 19.48% surprise. The estimated earnings for the next quarter are 4.59 USD per share. See more details about Deere & Company earnings.
Deere & Company revenue for the last quarter amounts to 11.17 B USD, despite the estimated figure of 10.79 B USD. In the next quarter, revenue is expected to reach 10.31 B USD.
DE net income for the last quarter is 1.80 B USD, while the quarter before that showed 869.00 M USD of net income which accounts for 107.59% change. Track more Deere & Company financial stats to get the full picture.
Yes, DE dividends are paid quarterly. The last dividend per share was 1.62 USD. As of today, Dividend Yield (TTM)% is 1.19%. Tracking Deere & Company dividends might help you take more informed decisions.
Deere & Company dividend yield was 1.44% in 2024, and payout ratio reached 22.95%. The year before the numbers were 1.40% and 14.58% correspondingly. See high-dividend stocks and find more opportunities for your portfolio.
As of Jun 23, 2025, the company has 75.8 K employees. See our rating of the largest employees — is Deere & Company on this list?
EBITDA measures a company's operating performance, its growth signifies an improvement in the efficiency of a company. Deere & Company EBITDA is 12.53 B USD, and current EBITDA margin is 28.44%. See more stats in Deere & Company financial statements.
Like other stocks, DE shares are traded on stock exchanges, e.g. Nasdaq, Nyse, Euronext, and the easiest way to buy them is through an online stock broker. To do this, you need to open an account and follow a broker's procedures, then start trading. You can trade Deere & Company stock right from TradingView charts — choose your broker and connect to your account.
Investing in stocks requires a comprehensive research: you should carefully study all the available data, e.g. company's financials, related news, and its technical analysis. So Deere & Company technincal analysis shows the buy rating today, and its 1 week rating is buy. Since market conditions are prone to changes, it's worth looking a bit further into the future — according to the 1 month rating Deere & Company stock shows the strong buy signal. See more of Deere & Company technicals for a more comprehensive analysis.
If you're still not sure, try looking for inspiration in our curated watchlists.
If you're still not sure, try looking for inspiration in our curated watchlists.