FS KKR Not holding up.We are not in the business of getting every prediction right, no one ever does and that is not the aim of the game. The Fibonacci targets are highlighted in purple with invalidation in red. Confirmation level, where relevant, is a pink dotted, finite line. Fibonacci goals, it is prudent to suggest,
Next report date
—
Report period
—
EPS estimate
—
Revenue estimate
—
1.90 USD
585.00 M USD
1.25 B USD
279.23 M
About FS KKR Capital Corp.
Sector
Industry
CEO
Michael Craig Forman
Website
Headquarters
Philadelphia
Founded
2007
FIGI
BBG001YCZP63
FS KKR Capital Corp. is an externally managed, non-diversified, and closed-end management investment company that has been elected to be regulated as a business development company. Its portfolio includes FS Investments and KKR Credit. The company was founded by Michael Craig Forman on December 21, 2007 and is headquartered in Philadelphia, PA.
Related stocks

FS KKR Capital X Waving. FSKAnd that means we are going up in the interim, and generally speaking, this will be for a shorter amount of time than the time we have been meandering so far. Bullish on this one and it looks like we have already made a start on this one.
We are not in the business of getting every prediction right

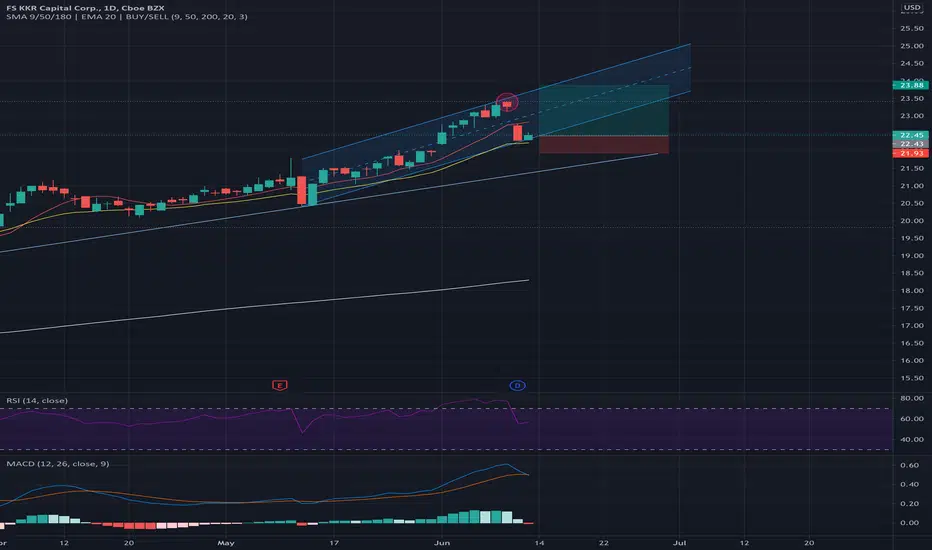
FSK ChannelNice channel. 52w high highlighted in red circle.
Good earnings. Low P/E. Analysts rate buy.
There is a longer term trend line below the channel. If you wanted to increase your win chances you could place SL below that line. That would reduce your RR quite a bit though.
Long $fsk Looks like this could meet resiatnce at $20 as that is a long term hurddle...
if we clear that then there's nt much keeping us down


Eyeball Analysis 3/7/19
FSK is +0.31% from open, +0.63% from yesterday's close, perf week -1.85%, perf month -0.16%
Change from open and yesterday's close is positive, but month and week performance are negative. But this stock passes the eye test. It looks like it has potential to go green. NYSE:FSK

See all ideas
Summarizing what the indicators are suggesting.
Neutral
SellBuy
Strong sellStrong buy
Strong sellSellNeutralBuyStrong buy
Neutral
SellBuy
Strong sellStrong buy
Strong sellSellNeutralBuyStrong buy
Neutral
SellBuy
Strong sellStrong buy
Strong sellSellNeutralBuyStrong buy
An aggregate view of professional's ratings.
Neutral
SellBuy
Strong sellStrong buy
Strong sellSellNeutralBuyStrong buy
Neutral
SellBuy
Strong sellStrong buy
Strong sellSellNeutralBuyStrong buy
Neutral
SellBuy
Strong sellStrong buy
Strong sellSellNeutralBuyStrong buy
Displays a symbol's price movements over previous years to identify recurring trends.
Frequently Asked Questions
The current price of FSK is 20.60 USD — it has decreased by −1.95% in the past 24 hours. Watch FS KKR Capital Corp. stock price performance more closely on the chart.
Depending on the exchange, the stock ticker may vary. For instance, on NYSE exchange FS KKR Capital Corp. stocks are traded under the ticker FSK.
FSK stock has fallen by −4.59% compared to the previous week, the month change is a −2.56% fall, over the last year FS KKR Capital Corp. has showed a 6.19% increase.
We've gathered analysts' opinions on FS KKR Capital Corp. future price: according to them, FSK price has a max estimate of 24.00 USD and a min estimate of 18.00 USD. Watch FSK chart and read a more detailed FS KKR Capital Corp. stock forecast: see what analysts think of FS KKR Capital Corp. and suggest that you do with its stocks.
FSK stock is 1.00% volatile and has beta coefficient of 0.58. Track FS KKR Capital Corp. stock price on the chart and check out the list of the most volatile stocks — is FS KKR Capital Corp. there?
Today FS KKR Capital Corp. has the market capitalization of 5.76 B, it has decreased by −3.79% over the last week.
Yes, you can track FS KKR Capital Corp. financials in yearly and quarterly reports right on TradingView.
FS KKR Capital Corp. is going to release the next earnings report on Aug 11, 2025. Keep track of upcoming events with our Earnings Calendar.
FSK earnings for the last quarter are 0.65 USD per share, whereas the estimation was 0.64 USD resulting in a 1.01% surprise. The estimated earnings for the next quarter are 0.63 USD per share. See more details about FS KKR Capital Corp. earnings.
FS KKR Capital Corp. revenue for the last quarter amounts to 400.00 M USD, despite the estimated figure of 395.07 M USD. In the next quarter, revenue is expected to reach 401.63 M USD.
FSK net income for the last quarter is 120.00 M USD, while the quarter before that showed 147.00 M USD of net income which accounts for −18.37% change. Track more FS KKR Capital Corp. financial stats to get the full picture.
FS KKR Capital Corp. dividend yield was 12.89% in 2024, and payout ratio reached 134.05%. The year before the numbers were 14.02% and 112.75% correspondingly. See high-dividend stocks and find more opportunities for your portfolio.
EBITDA measures a company's operating performance, its growth signifies an improvement in the efficiency of a company. FS KKR Capital Corp. EBITDA is 1.00 B USD, and current EBITDA margin is 81.42%. See more stats in FS KKR Capital Corp. financial statements.
Like other stocks, FSK shares are traded on stock exchanges, e.g. Nasdaq, Nyse, Euronext, and the easiest way to buy them is through an online stock broker. To do this, you need to open an account and follow a broker's procedures, then start trading. You can trade FS KKR Capital Corp. stock right from TradingView charts — choose your broker and connect to your account.
Investing in stocks requires a comprehensive research: you should carefully study all the available data, e.g. company's financials, related news, and its technical analysis. So FS KKR Capital Corp. technincal analysis shows the sell today, and its 1 week rating is sell. Since market conditions are prone to changes, it's worth looking a bit further into the future — according to the 1 month rating FS KKR Capital Corp. stock shows the sell signal. See more of FS KKR Capital Corp. technicals for a more comprehensive analysis.
If you're still not sure, try looking for inspiration in our curated watchlists.
If you're still not sure, try looking for inspiration in our curated watchlists.