NZD/CAD - Triangle Breakout (05.08.2025)The NZD/CAD Pair on the M30 timeframe presents a Potential Selling Opportunity due to a recent Formation of a Triangle Breakout Pattern. This suggests a shift in momentum towards the downside in the coming hours.
Possible Short Trade:
Entry: Consider Entering A Short Position around Trendline O
Related currencies

Bearish Gameplan Activated – NZD/CAD Heist Operation💣 NZD/CAD “Kiwi vs Loonie” Forex Vault Robbery Heist Plan 🔫💰
Bearish Plan | Multiple Limit Orders | Scalping/Swing Style
🧠💼 Welcome to another high-stakes Thief Trader Heist – this time we're targeting the NZD/CAD vault. The Loonie's got weakness in its wings, and the Kiwi’s already flapping into t

Bullish rise?NZD/CAD has bounced off the pivot and could rise to the 1st resistance.
Pivot: 0.81602
1st Support: 0.81199
1st Resistance:0.82167
Risk Warning:
Trading Forex and CFDs carries a high level of risk to your capital and you should only trade with money you can afford to lose. Trading Forex and CFDs

NZD-CAD Will Go UP! Buy!
Hello,Traders!
NZD-CAD made a retest
Of the horizontal support level
Of 0.8125 from where we
Are already seeing a nice
Bullish rebound so we will
Be expecting a further
Bullish move up
Buy!
Comment and subscribe to help us grow!
Check out other forecasts below too!
Disclosure: I am part o

NZD-CAD Bullish Flag Breakout! Buy!
Hello,Traders!
NZD-CAD made a bullish
Breakout from the bullish
Flag pattern and the breakout
Is confirmed so we are
Bullish biased and we will
Be expecting a further
Bullish move up
Buy!
Comment and subscribe to help us grow!
Check out other forecasts below too!
Disclosure: I am part o

NZDCAD SHORT Market structure bearish on HTFs DW
Entry at both weekly and daily
Weekly Rejection at AOi
Previous Weekly Structure Point
Daily Rejection at AOi
Daily EMA retest
Previous Structure point Daily
Around Psychological Level 0.82000
H4 Candlestick rejection
Levels 3.23
Entry 100%
REMEMBER : Tradin

(art📊 Smart Money Concept Trade Setup (NZD/CAD – 30-Min Chart)
🧠 Market Structure Overview:
Price initially formed a Lower Low (left side of the chart).
Then, price made a clear Break of Structure (BOS) to the upside, creating a Higher High.
An IDM indicates price manipulation and confirms liquidity r

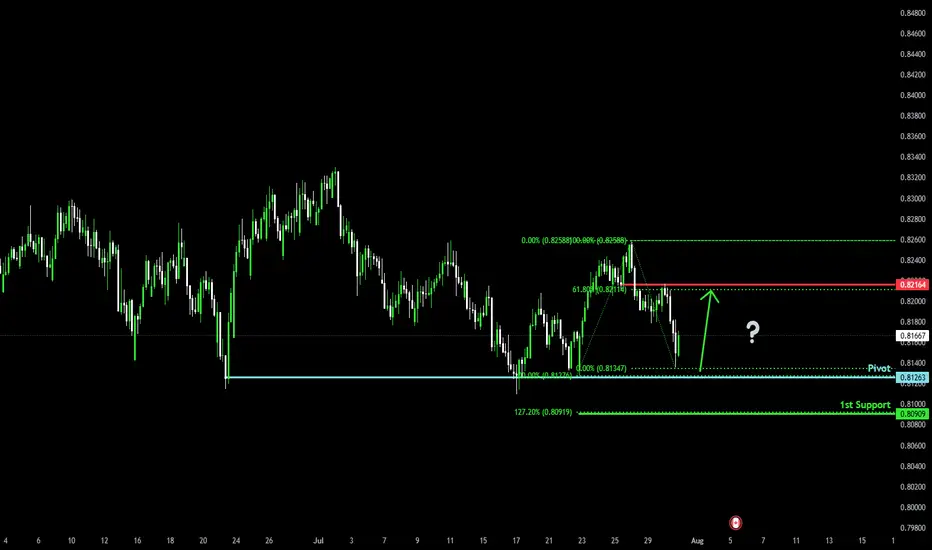
Bullish reversal?NZD/CAD is falling towards the pivot an could bounce to the 1st resistance.
Pivot: 0.81263
1st Support: 0.80909
1st Resistance: 0.82164
Risk Warning:
Trading Forex and CFDs carries a high level of risk to your capital and you should only trade with money you can afford to lose. Trading Forex and

A Top Down Approach will help you spot quality tradesAll the information you need to find a high probability trade are in front of you on the charts so build your trading decisions on 'the facts' of the chart NOT what you think or what you want to happen or even what you heard will happen. If you have enough facts telling you to trade in a certain dir

See all ideas
Displays a symbol's price movements over previous years to identify recurring trends.
Frequently Asked Questions
The value of the NZDCAD pair is quoted as 1 NZD per x CAD. For example, if the pair is trading at 1.50, it means it takes 1.5 CAD to buy 1 NZD.
NZDCAD is a minor currency pair, i.e. a popular pair that is not associated with USD. Such pairs are also called cross currency pairs.
Currencies are usually traded through forex brokers — choose the one that suits your needs and go ahead. You can trade NZDCAD right from TradingView charts — just log in to you broker account. Check out the list of our integrated brokers and find the best one for your needs and strategy.