NZD_CAD LOCAL LONG|
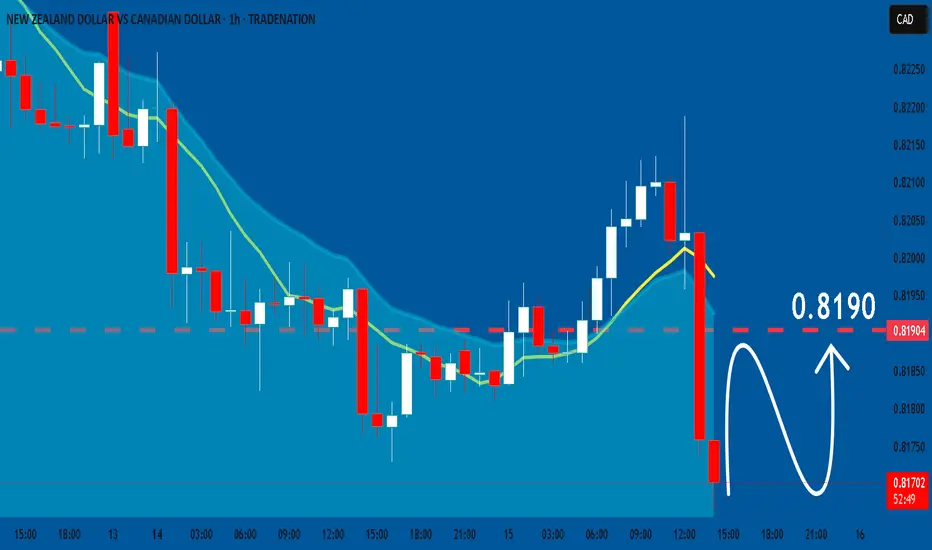
✅NZD_CAD is set to retest a
Strong support level below at 0.8114
After trading in a local downtrend for some time
Which makes a bullish rebound a likely scenario
With the target being a local resistance above at 0.8145
LONG🚀
✅Like and subscribe t
Related currencies

NZDCAD Bullish 15 min ICT 15 minute Entry:
1. Sell - side liquidity swept.
2. BOS up onM15 confirm shift.
3. Entry from bullish OB or FVG after pullback.
4. SL below liquidity sweep.
5. TP internal high/TP2 premium zone.

BULLISH COT DATA last friday for NZDCADLast week COT data is bullish for NZDCAD
Daily Support is at 0.812
0.812 is the origin of the Daily bullish move
That broke 0.832 resistance, creating a higher high.
Target is 0.834
This is a swing trade.

BuyRejection Level
Daily Volume
Market Structure Shift
London Session
Trend Line Break
Untapped Order Point

[LONG] NZDCAD Daily bullish. 4H shifted bullish gears signal BUYCOT data suggests institutions are buying NZD less than CAD by the COT Friday release.
Marked on the daily chart, a bullish break of structure.
If we look at 4H timeframe, an internal bullish structure happened last Friday. This can be a signal that the Daily correction/pullback is done.
An inter

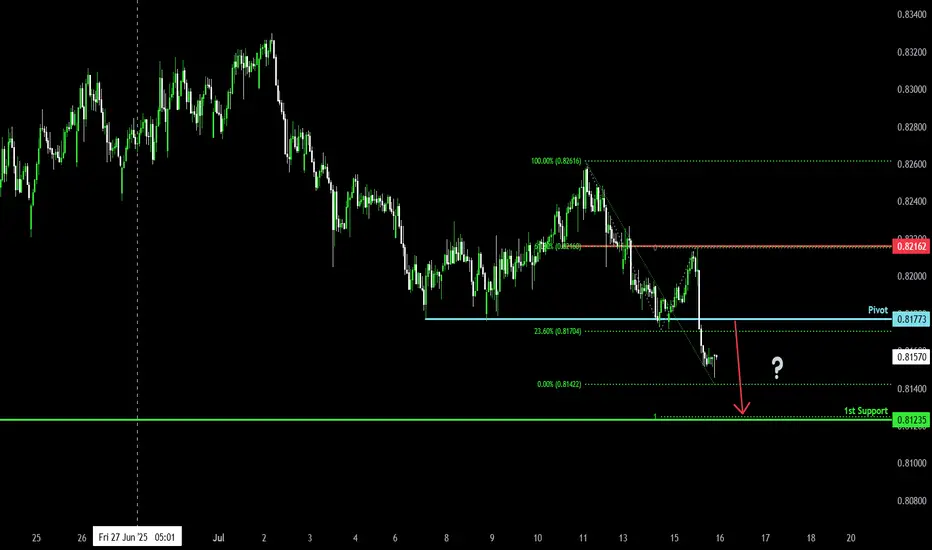
Bearish continuation?NZD/CAD is rising towards the pivot and could drop to the 1st support.
Pivot: 0.81773
1st Support: 0.81235
1st Resistance: 0.82162
Risk Warning:
Trading Forex and CFDs carries a high level of risk to your capital and you should only trade with money you can afford to lose. Trading Forex and CFDs
NZDCAD SHORTThe Price of the New Zealand Dollar to the Canadian Dollar, has been in a downtrend for the month of July, and the canadian dollar is having a strong index for this month, after the break and retest of the daily zone to the downside,my bias is a short.

NZDCAD: Will Start Growing! Here is Why:
Our strategy, polished by years of trial and error has helped us identify what seems to be a great trading opportunity and we are here to share it with you as the time is ripe for us to buy NZDCAD.
Disclosure: I am part of Trade Nation's Influencer program and receive a monthly fee for using thei
NZDCAD SHORT Market structure bearish on HTFs DH
Entry at both Weekly and Daily AOi
Weekly Rejection at AOi
Daily Rejection at AOi
Previous Structure point Daily
Around Psychological Level 0.82000
H4 EMA retest
H4 Candlestick rejection
Rejection from Previous structure
Levels 2.66
Entry 100%
REMEMBER : Trad

BUY NZDCADNZDCAD price looking to recover yesterday's loss. A falling channel pattern seems complete an ready to break to the upside. Buy

See all ideas
Summarizing what the indicators are suggesting.
Oscillators
Neutral
SellBuy
Strong sellStrong buy
Strong sellSellNeutralBuyStrong buy
Oscillators
Neutral
SellBuy
Strong sellStrong buy
Strong sellSellNeutralBuyStrong buy
Summary
Neutral
SellBuy
Strong sellStrong buy
Strong sellSellNeutralBuyStrong buy
Summary
Neutral
SellBuy
Strong sellStrong buy
Strong sellSellNeutralBuyStrong buy
Summary
Neutral
SellBuy
Strong sellStrong buy
Strong sellSellNeutralBuyStrong buy
Moving Averages
Neutral
SellBuy
Strong sellStrong buy
Strong sellSellNeutralBuyStrong buy
Moving Averages
Neutral
SellBuy
Strong sellStrong buy
Strong sellSellNeutralBuyStrong buy
Displays a symbol's price movements over previous years to identify recurring trends.
Frequently Asked Questions
The current rate of NZDCAD is 0.81823 CAD — it has increased by 0.32% in the past 24 hours. See more of NZDCAD rate dynamics on the detailed chart.
The value of the NZDCAD pair is quoted as 1 NZD per x CAD. For example, if the pair is trading at 1.50, it means it takes 1.5 CAD to buy 1 NZD.
The term volatility describes the risk related to the changes in an asset's value. NZDCAD has the volatility rating of 0.66%. Track all currencies' changes with our live Forex Heatmap and prepare for markets volatility.
The NZDCAD showed a −0.72% fall over the past week, the month change is a −0.80% fall, and over the last year it has decreased by −1.35%. Track live rate changes on the NZDCAD chart.
Learn how you can make money on rate changes in numerous trading ideas created by our community.
Learn how you can make money on rate changes in numerous trading ideas created by our community.
NZDCAD is a minor currency pair, i.e. a popular pair that is not associated with USD. Such pairs are also called cross currency pairs.
Currencies are usually traded through forex brokers — choose the one that suits your needs and go ahead. You can trade NZDCAD right from TradingView charts — just log in to you broker account. Check out the list of our integrated brokers and find the best one for your needs and strategy.
When deciding to buy or sell currency one should keep in mind many factors including current geopolitical situation, interest rates, and other. But before plunging into a deep research, you can start with NZDCAD technical analysis. The technical rating for the pair is sell today, but don't forget that markets can be very unstable, so don't stop here. According to our 1 week rating the NZDCAD shows the sell signal, and 1 month rating is sell. See more of NZDCAD technicals for a more comprehensive analysis.