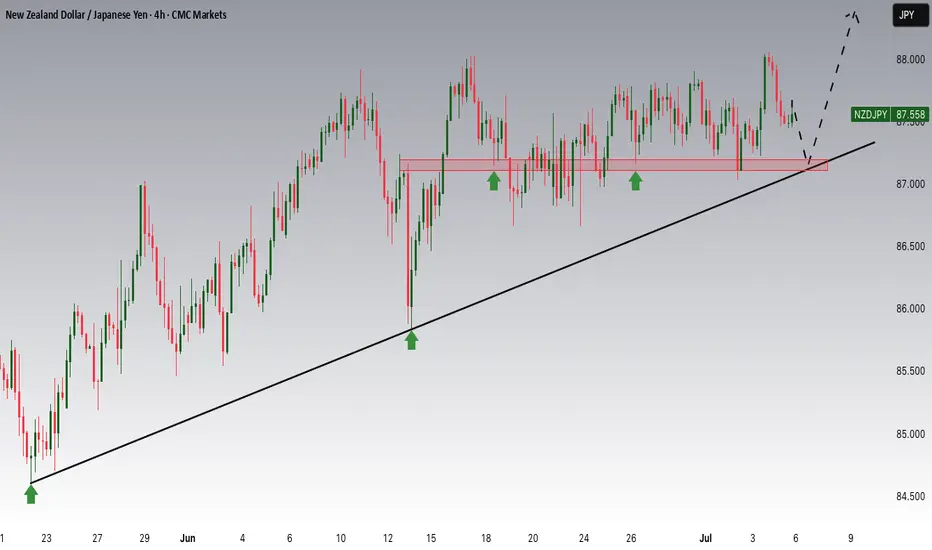
NZDJPY Potential UpsidesHey Traders, in the coming week we are monitoring NZDJPY for a buying opportunity around 87.200 zone, NZDJPY is trading in an uptrend and currently is in a correction phase in which it is approaching the trend at 87.200 support and resistance area.
Trade safe, Joe.
Related currencies
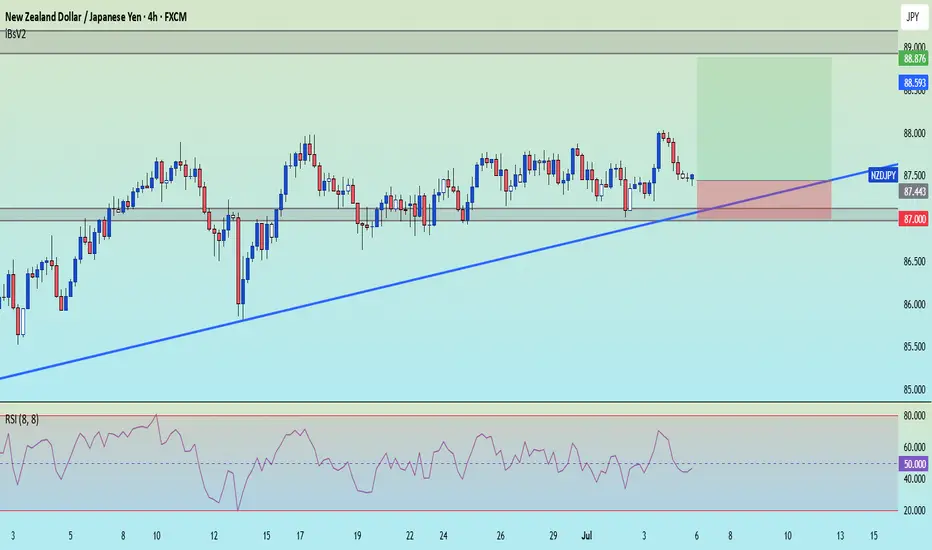
NZDJPY - bulls are exhausted! Hello TradingView Family / Fellow Traders. This is Richard, also known as theSignalyst.
📈NZDJPY has been overall bullish trading within the rising flat channel marked in blue and it is currently retesting the upper bound of it.
Moreover, the green zone is a strong structure.
🏹 Thus, the highlig

NZDJPY Technical + Fundamental Short Alignment = Short SetupToday, I want to review the NZDJPY ( OANDA:NZDJPY ) pair short position from a fundamental and technical perspective . It seems to be in a good zone for a short position.
Do you agree with me?
----------------------------------------
First, let's look at the fundamentals of NZDJPY.
New

NZDJPY Strong Breakout!
HI,Traders !
NZDJPY is trading in an
Uptrend and the pair has
Made a bullish breakout of
The key horizontal level
Of 87.394 and the breakout
Is confirmed so we are
Bullish biased and we
Will be expecting a further
Bullish move up !
Comment and subscribe to help us grow !

NZDJPY Potential UpsidesHey Traders, in today's trading session we are monitoring NZDJPY for a buying opportunity around 87.250 zone, NZDJPY is trading in an uptrend and currently is in a correction phase in which it is approaching the trend at 87.250 support and resistance area.
Trade safe, Joe.

NZDJPY H4 LongNZDJPY finish the downtrend correction and ready to go long. price is above EMA 200 .
in H4 is the uptrend started and price above strong Support/Resistant area.
Buy NZDJPY Buy Opportunities on NZDJPY
ENTRY: 87.100
STOPLOSS: 86.900
TAKE PROFIT: 88.00
COMMENT YOUR OPINION
For fund management contact me on X @shajudeakinoba1

NZDJPY to find sellers at market price?NZDJPY - 24h expiry
Trading has been mixed and volatile.
Price action looks to be forming a top.
We look for a temporary move higher.
Preferred trade is to sell into rallies.
Bespoke resistance is located at 87.80.
We look to Sell at 87.80 (stop at 88.00)
Our profit targets will be 87.00 an

NZD_JPY WAIT FOR BREAKOUT|LONG|
✅NZD_JPY is trading in an
Uptrend and the pair has formed
A bullish triangle pattern
And we are bullish biased
So IF we see a bullish breakout
It will be our signal that
A bullish continuation is
Likely and we will be
Able to enter a long trade
LONG🚀
✅Like and subscribe to never miss a new

Nzd/JpY Sell 2 Buy.Since well now the supply area is mitigated and about to drop to demand area which is resting at the flipped zone created as strong buy zone for buyers .
I will see how it goes ..
HappY Trading

See all ideas
Summarizing what the indicators are suggesting.
Oscillators
Neutral
SellBuy
Strong sellStrong buy
Strong sellSellNeutralBuyStrong buy
Oscillators
Neutral
SellBuy
Strong sellStrong buy
Strong sellSellNeutralBuyStrong buy
Summary
Neutral
SellBuy
Strong sellStrong buy
Strong sellSellNeutralBuyStrong buy
Summary
Neutral
SellBuy
Strong sellStrong buy
Strong sellSellNeutralBuyStrong buy
Summary
Neutral
SellBuy
Strong sellStrong buy
Strong sellSellNeutralBuyStrong buy
Moving Averages
Neutral
SellBuy
Strong sellStrong buy
Strong sellSellNeutralBuyStrong buy
Moving Averages
Neutral
SellBuy
Strong sellStrong buy
Strong sellSellNeutralBuyStrong buy
Displays a symbol's price movements over previous years to identify recurring trends.
Frequently Asked Questions
The current rate of NZDJPY is 87.915 JPY — it has increased by 0.27% in the past 24 hours. See more of NZDJPY rate dynamics on the detailed chart.
The value of the NZDJPY pair is quoted as 1 NZD per x JPY. For example, if the pair is trading at 1.50, it means it takes 1.5 JPY to buy 1 NZD.
The term volatility describes the risk related to the changes in an asset's value. NZDJPY has the volatility rating of 0.82%. Track all currencies' changes with our live Forex Heatmap and prepare for markets volatility.
The NZDJPY showed a 0.16% rise over the past week, the month change is a 1.39% rise, and over the last year it has decreased by −10.82%. Track live rate changes on the NZDJPY chart.
Learn how you can make money on rate changes in numerous trading ideas created by our community.
Learn how you can make money on rate changes in numerous trading ideas created by our community.
NZDJPY is a minor currency pair, i.e. a popular pair that is not associated with USD. Such pairs are also called cross currency pairs.
Currencies are usually traded through forex brokers — choose the one that suits your needs and go ahead. You can trade NZDJPY right from TradingView charts — just log in to you broker account. Check out the list of our integrated brokers and find the best one for your needs and strategy.
When deciding to buy or sell currency one should keep in mind many factors including current geopolitical situation, interest rates, and other. But before plunging into a deep research, you can start with NZDJPY technical analysis. The technical rating for the pair is strong buy today, but don't forget that markets can be very unstable, so don't stop here. According to our 1 week rating the NZDJPY shows the buy signal, and 1 month rating is buy. See more of NZDJPY technicals for a more comprehensive analysis.