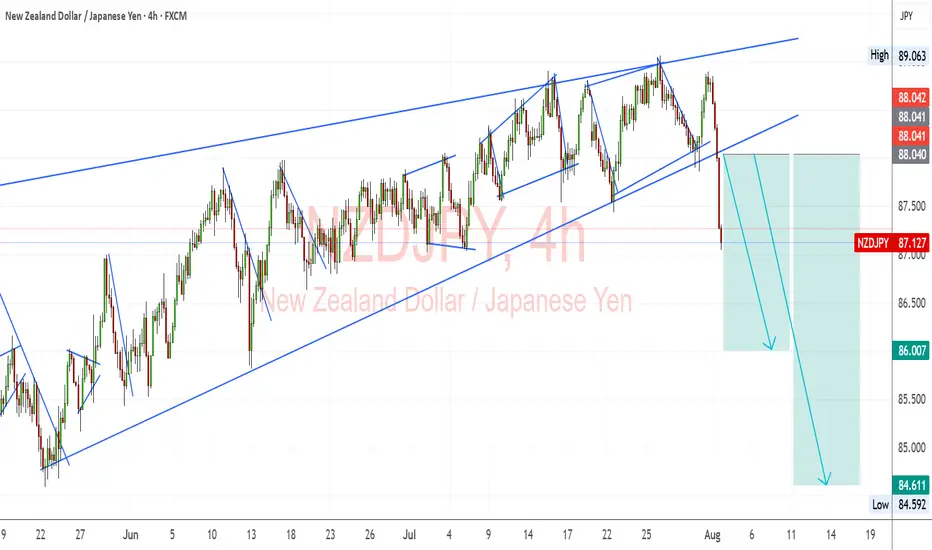
NZD/JPY: Bearish Breakdown from Ascending ChannelNZD/JPY has decisively broken below its ascending channel, signaling a shift from bullish structure to bearish momentum. This move aligns with fundamental headwinds for NZD and the potential for JPY strength amid intervention risks and global risk-off sentiment.
Technical Analysis (4H Chart)
Patter
Related currencies
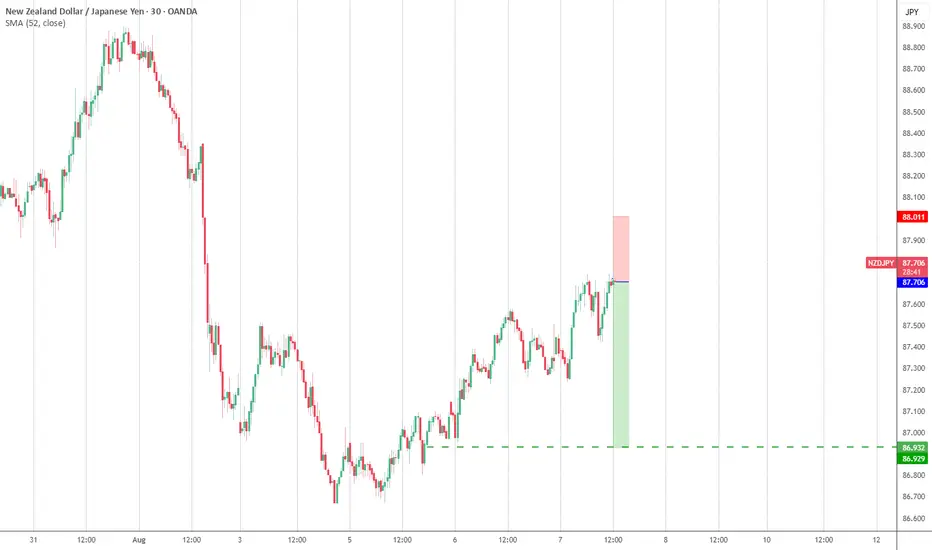
NZD-JPY Will Go Down! Sell!
Hello,Traders!
NZD-JPY made a retest
Of the horizontal resistance
Level of 87.700 from where
We are already seeing a bearish
Reaction so we area locally
Bearish biased and we will
Be expecting a local
Bearish move down
Sell!
Comment and subscribe to help us grow!
Check out other forecasts bel

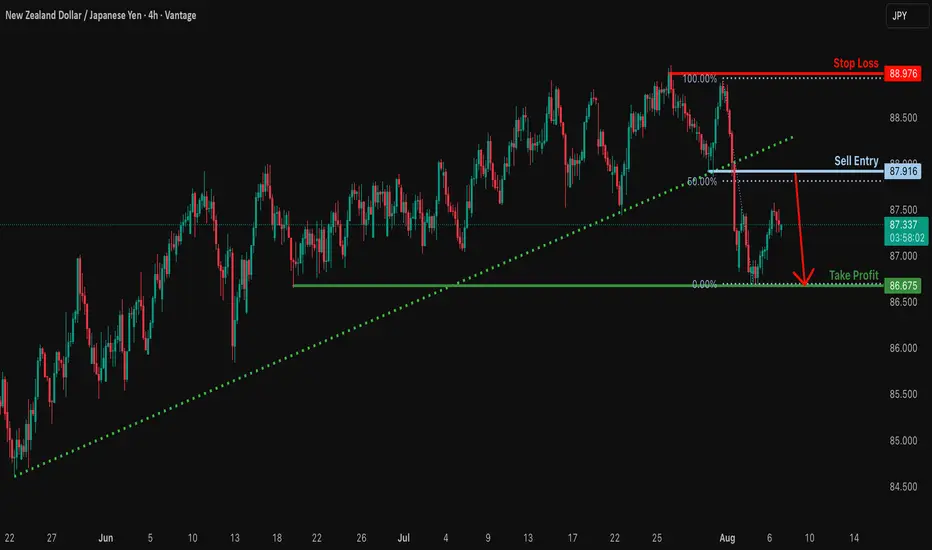
Bearish reversal?NZD/JPY is rising towards the resistance level which is a pullback resistance that aligns with the 50% Fibonacci retracement and could drop from this level to our take profit.
Entry: 87.91
Why we like it:
There is a pullback resistance that lines up with the 50% Fibonacci retracement.
Stop loss: 8
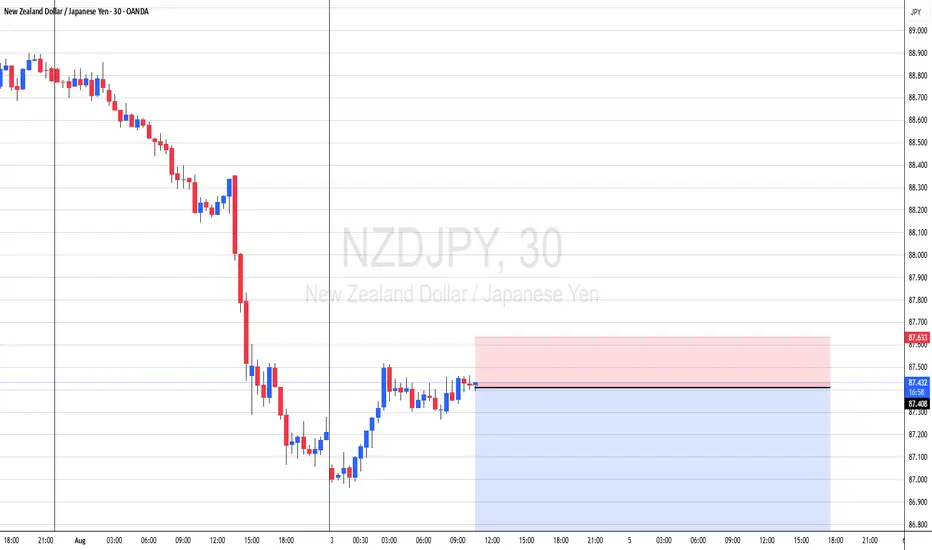
NZDJPY to find buyers at previous support?NZDJPY - 24h expiry
Previous support located at 87.60.
87.44 has been pivotal.
Dip buying offers good risk/reward.
The overnight dip has been bought into and there is scope for further bullish pressure going into this morning.
Prices have reacted from 86.67.
We look to Buy at 87.57 (stop at

NZDJPY 1H Sell SetupWe can see that NZDJPY has induced (IDM) and taken out the buy side liquidity, after that the market broke through the resistance area and rapidly came back in with high volume. Now we focus on the Price leg it created which has 1H order block +_ fvg for selling opportunities.

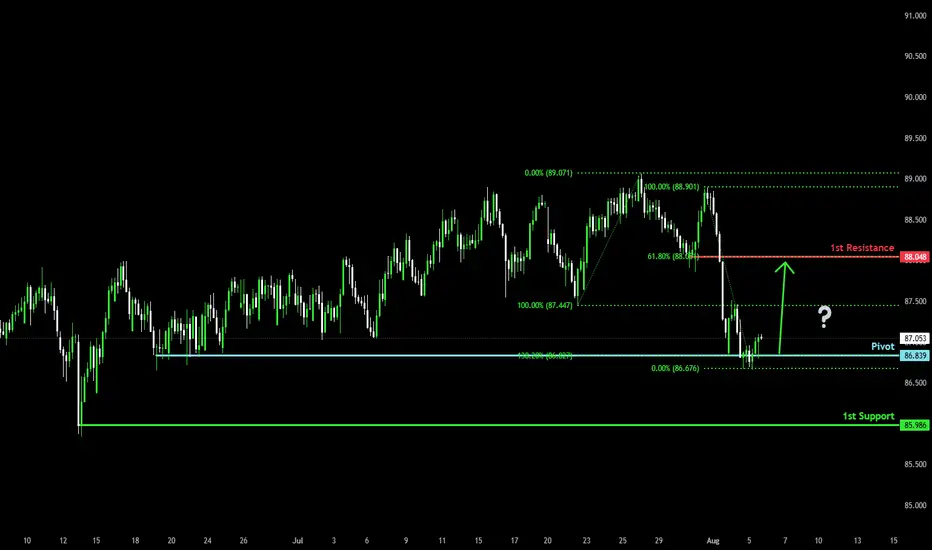
Bullish reversal?NZD/JPY is reacting off the pivot and could bounce to the 1st resistance which acts as a pullback resistance.
Pivot: 86.83
1st Support: 85.98
1st Resistance: 88.04
Risk Warning:
Trading Forex and CFDs carries a high level of risk to your capital and you should only trade with money you can affor
nzdjpyThis pair is confusing people but the true is that it will fall strong.
Let´s go.
Blessings.
"passiveincomes" in signal start.
I see you there.
Potential bearish drop?NZD/JPY is reacting off the pivot and could drop to the 1st support, which is slightly above the 61.8% Fibonacci retracement.
Pivot: 87.98
1st Support: 87.39
1st Resistance: 88.54
Risk Warning:
Trading Forex and CFDs carries a high level of risk to your capital and you should only trade with mon

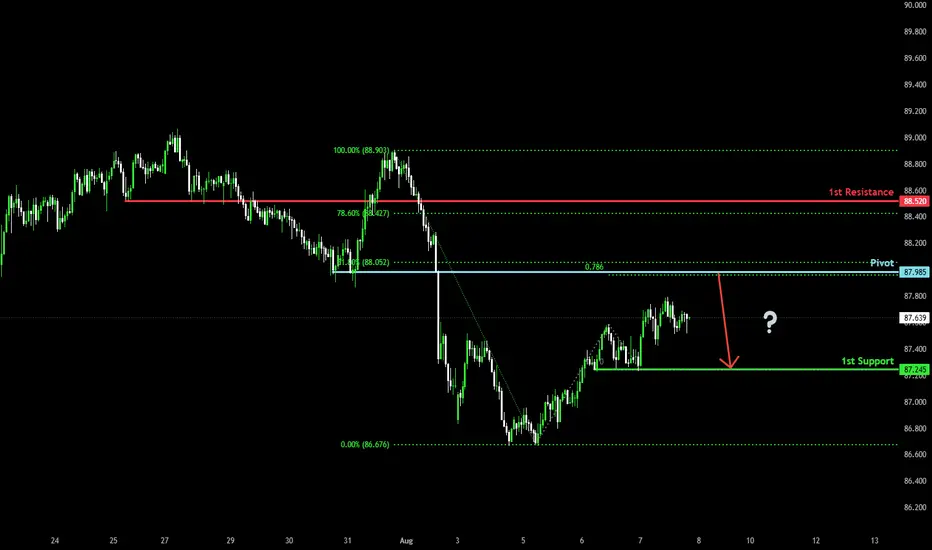
Bearish reversal off pullback resistance?NZD/JPY is rising towards the pivot, which acts as a pullback resistance that is slightly below the 61.8% Fibonacci retracement and could reverse to the 1st support.
Pivot: 87.98
1st Support: 87.24
1st Resistance: 88.52
Risk Warning:
Trading Forex and CFDs carries a high level of risk to your ca
See all ideas
Summarizing what the indicators are suggesting.
Oscillators
Neutral
SellBuy
Strong sellStrong buy
Strong sellSellNeutralBuyStrong buy
Oscillators
Neutral
SellBuy
Strong sellStrong buy
Strong sellSellNeutralBuyStrong buy
Summary
Neutral
SellBuy
Strong sellStrong buy
Strong sellSellNeutralBuyStrong buy
Summary
Neutral
SellBuy
Strong sellStrong buy
Strong sellSellNeutralBuyStrong buy
Summary
Neutral
SellBuy
Strong sellStrong buy
Strong sellSellNeutralBuyStrong buy
Moving Averages
Neutral
SellBuy
Strong sellStrong buy
Strong sellSellNeutralBuyStrong buy
Moving Averages
Neutral
SellBuy
Strong sellStrong buy
Strong sellSellNeutralBuyStrong buy
Displays a symbol's price movements over previous years to identify recurring trends.
Frequently Asked Questions
The current rate of NZDJPY is 88.131 JPY — it has increased by 0.25% in the past 24 hours. See more of NZDJPY rate dynamics on the detailed chart.
The value of the NZDJPY pair is quoted as 1 NZD per x JPY. For example, if the pair is trading at 1.50, it means it takes 1.5 JPY to buy 1 NZD.
The term volatility describes the risk related to the changes in an asset's value. NZDJPY has the volatility rating of 0.48%. Track all currencies' changes with our live Forex Heatmap and prepare for markets volatility.
The NZDJPY showed a 1.34% rise over the past week, the month change is a −0.37% fall, and over the last year it has decreased by −0.52%. Track live rate changes on the NZDJPY chart.
Learn how you can make money on rate changes in numerous trading ideas created by our community.
Learn how you can make money on rate changes in numerous trading ideas created by our community.
NZDJPY is a minor currency pair, i.e. a popular pair that is not associated with USD. Such pairs are also called cross currency pairs.
Currencies are usually traded through forex brokers — choose the one that suits your needs and go ahead. You can trade NZDJPY right from TradingView charts — just log in to you broker account. Check out the list of our integrated brokers and find the best one for your needs and strategy.
When deciding to buy or sell currency one should keep in mind many factors including current geopolitical situation, interest rates, and other. But before plunging into a deep research, you can start with NZDJPY technical analysis. The technical rating for the pair is buy today, but don't forget that markets can be very unstable, so don't stop here. According to our 1 week rating the NZDJPY shows the buy signal, and 1 month rating is buy. See more of NZDJPY technicals for a more comprehensive analysis.