NZDJPY - bulls are exhausted! Hello TradingView Family / Fellow Traders. This is Richard, also known as theSignalyst.
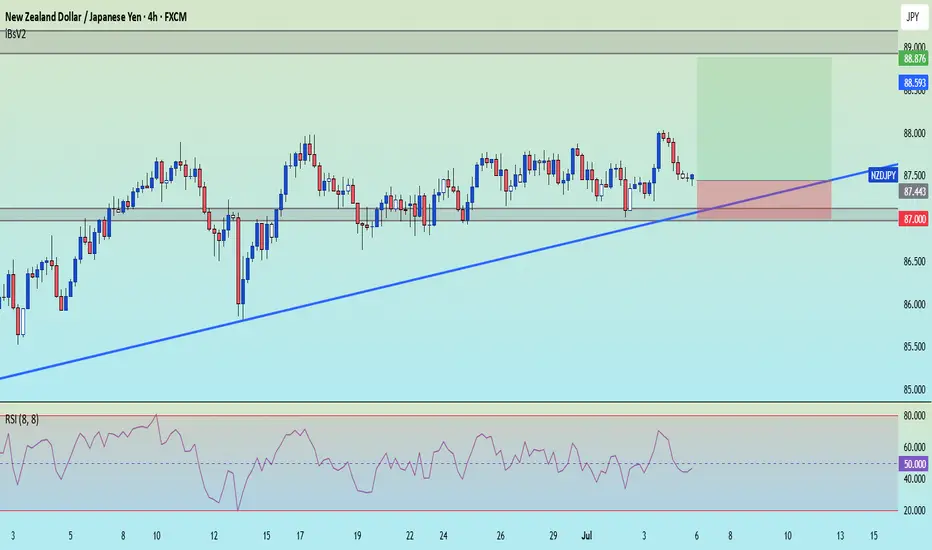
📈NZDJPY has been overall bullish trading within the rising flat channel marked in blue and it is currently retesting the upper bound of it.
Moreover, the green zone is a strong structure.
🏹 Thus, the highlig
Related currencies

NZDJPY SELLDetailed NZD JPY forecast as well as a New Zealand Dollar Japanese Yen technical analysis through moving averages, buy/sell signals, and common chart
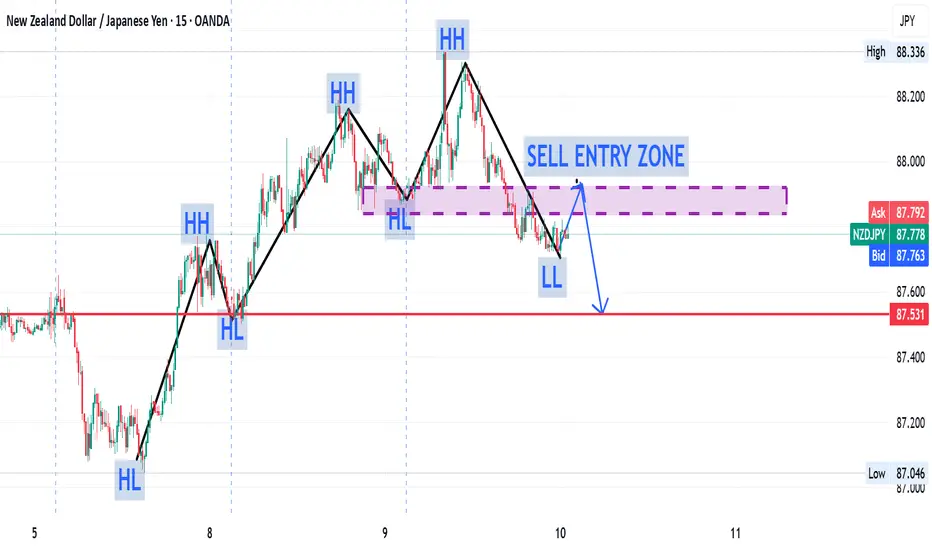
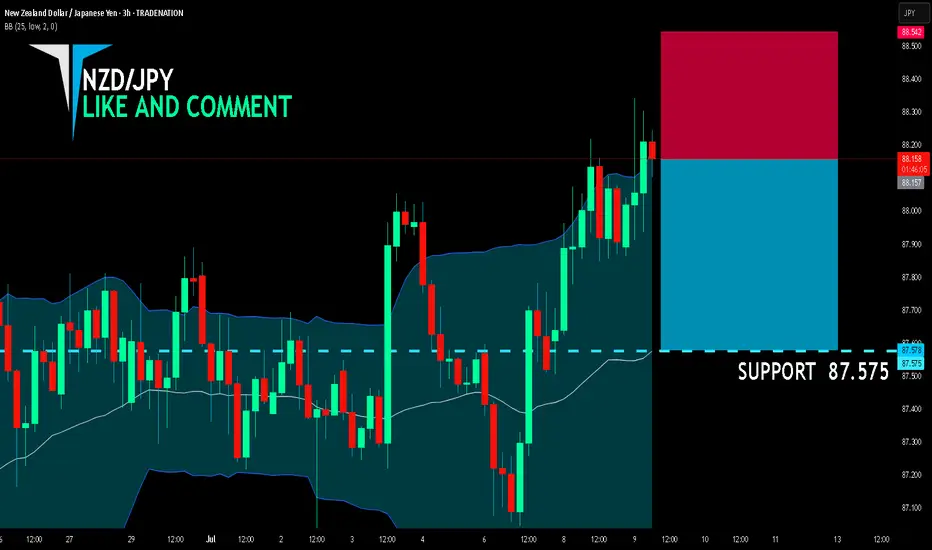
NZD/JPY BEARS ARE STRONG HERE|SHORT
NZD/JPY SIGNAL
Trade Direction: short
Entry Level: 88.157
Target Level: 87.575
Stop Loss: 88.542
RISK PROFILE
Risk level: medium
Suggested risk: 1%
Timeframe: 3h
Disclosure: I am part of Trade Nation's Influencer program and receive a monthly fee for using their TradingView charts in my analysi
NZDJPY to find buyers at previous support?NZDJPY - 24h expiry
The primary trend remains bullish.
Short term RSI is moving lower.
Preferred trade is to buy on dips.
Risk/Reward would be poor to call a buy from current levels.
Bespoke support is located at 87.50.
We look to Buy at 87.50 (stop at 87.30)
Our profit targets will be 88.3

NZDJPY Potential UpsidesHey Traders, in the coming week we are monitoring NZDJPY for a buying opportunity around 87.200 zone, NZDJPY is trading in an uptrend and currently is in a correction phase in which it is approaching the trend at 87.200 support and resistance area.
Trade safe, Joe.
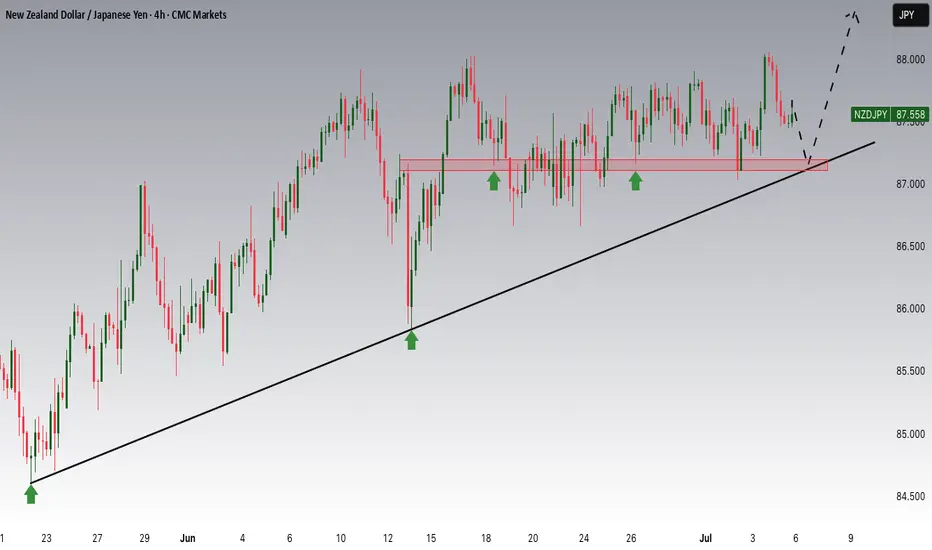
NZDJPY H4 LongNZDJPY finish the downtrend correction and ready to go long. price is above EMA 200 .
in H4 is the uptrend started and price above strong Support/Resistant area.
Buy NZDJPY Buy Opportunities on NZDJPY
ENTRY: 87.100
STOPLOSS: 86.900
TAKE PROFIT: 88.00
COMMENT YOUR OPINION
For fund management contact me on X @shajudeakinoba1

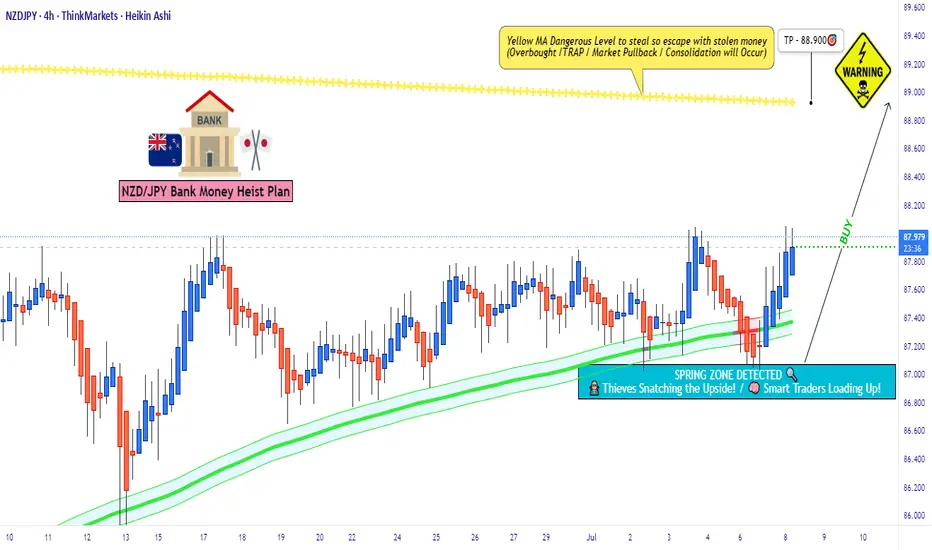
"Trap or Opportunity? NZD/JPY Smart Pullback Play?"💼🎯 NZD/JPY – The Kiwi Vault Breakout | Thief Trading Style Forex Blueprint 🔓📈
🌟Hola! Hello! Ola! Bonjour! Hallo! Marhaba, Global Market Raiders!🌍✨
Welcome to the Thief Trading Style – where smart traders strategize, strike, and secure the bag. This is not your regular trade idea... this is a market
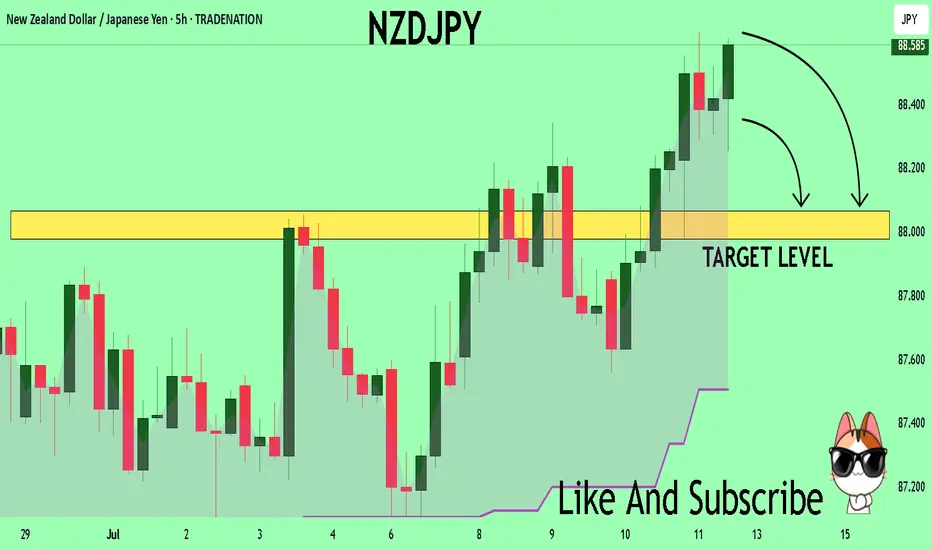
NZDJPY Buyers In Panic! SELL!
My dear followers,
This is my opinion on the NZDJPY next move:
The asset is approaching an important pivot point 88.573
Bias - Bearish
Technical Indicators: Supper Trend generates a clear short signal while Pivot Point HL is currently determining the overall Bearish trend of the market.
Goal
selling opportunity from resistance level-ForexbdNZDJPY is at a price resistance level in the H-4 market, so it is expected that the market will go into a downtrend from this level.
You can share your opinion.
⭕️Risk Warning : Trading on financial markets carries risks!
©FXBD Official Team

See all ideas
Summarizing what the indicators are suggesting.
Oscillators
Neutral
SellBuy
Strong sellStrong buy
Strong sellSellNeutralBuyStrong buy
Oscillators
Neutral
SellBuy
Strong sellStrong buy
Strong sellSellNeutralBuyStrong buy
Summary
Neutral
SellBuy
Strong sellStrong buy
Strong sellSellNeutralBuyStrong buy
Summary
Neutral
SellBuy
Strong sellStrong buy
Strong sellSellNeutralBuyStrong buy
Summary
Neutral
SellBuy
Strong sellStrong buy
Strong sellSellNeutralBuyStrong buy
Moving Averages
Neutral
SellBuy
Strong sellStrong buy
Strong sellSellNeutralBuyStrong buy
Moving Averages
Neutral
SellBuy
Strong sellStrong buy
Strong sellSellNeutralBuyStrong buy
Displays a symbol's price movements over previous years to identify recurring trends.
Frequently Asked Questions
The current rate of NZDJPY is 88.580 JPY — it has increased by 0.37% in the past 24 hours. See more of NZDJPY rate dynamics on the detailed chart.
The value of the NZDJPY pair is quoted as 1 NZD per x JPY. For example, if the pair is trading at 1.50, it means it takes 1.5 JPY to buy 1 NZD.
The term volatility describes the risk related to the changes in an asset's value. NZDJPY has the volatility rating of 0.73%. Track all currencies' changes with our live Forex Heatmap and prepare for markets volatility.
The NZDJPY showed a 0.71% rise over the past week, the month change is a 1.65% rise, and over the last year it has decreased by −8.63%. Track live rate changes on the NZDJPY chart.
Learn how you can make money on rate changes in numerous trading ideas created by our community.
Learn how you can make money on rate changes in numerous trading ideas created by our community.
NZDJPY is a minor currency pair, i.e. a popular pair that is not associated with USD. Such pairs are also called cross currency pairs.
Currencies are usually traded through forex brokers — choose the one that suits your needs and go ahead. You can trade NZDJPY right from TradingView charts — just log in to you broker account. Check out the list of our integrated brokers and find the best one for your needs and strategy.
When deciding to buy or sell currency one should keep in mind many factors including current geopolitical situation, interest rates, and other. But before plunging into a deep research, you can start with NZDJPY technical analysis. The technical rating for the pair is strong buy today, but don't forget that markets can be very unstable, so don't stop here. According to our 1 week rating the NZDJPY shows the buy signal, and 1 month rating is buy. See more of NZDJPY technicals for a more comprehensive analysis.