ONDOThis this my Candlestick Technical Analysis based on Bullish Engulfing. If we see and Same Pattern then the market will Bonus.
ONDOUSD trade ideas

ONDOUSDT Cryptocurrency Futures Market Disclaimer 🚨🚨🚨
Trading cryptocurrency futures involves high risks and is not suitable for all investors.
Cryptocurrency prices are highly volatile, which can lead to significant gains or losses in a short period.
Before engaging in crypto futures trading, consider your risk tolerance, experience, and financial situation.
Risk of Loss: You may lose more than your initial capital due to the leveraged nature of futures. You are fully responsible for any losses incurred.
Market Volatility: Crypto prices can fluctuate significantly due to factors such as market sentiment, regulations, or unforeseen events.
Leverage Risk: The use of leverage can amplify profits but also increases the risk of total loss.
Regulatory Uncertainty: Regulations related to cryptocurrencies vary by jurisdiction and may change, affecting the value or legality of trading.
Technical Risks: Platform disruptions, hacking, or technical issues may result in losses.
This information is not financial, investment, or trading advice. Consult a professional financial advisor before making decisions. We are not liable for any losses or damages arising from cryptocurrency futures trading.
Note: Ensure compliance with local regulations regarding cryptocurrency trading in your region.
thanks for like and follow @ydnldn to have more information outlook and free signal.
About me :
"I am a passionate swing trader focused on analyzing financial markets to capture profit opportunities from medium-term price movements. With a disciplined approach and in-depth technical analysis, I concentrate on identifying trends, support-resistance levels, and price patterns to make informed trading decisions. I prioritize strict risk management to protect capital while maximizing profit potential. Always learning and adapting to market dynamics, I enjoy the process of refining strategies to achieve consistency in trading."

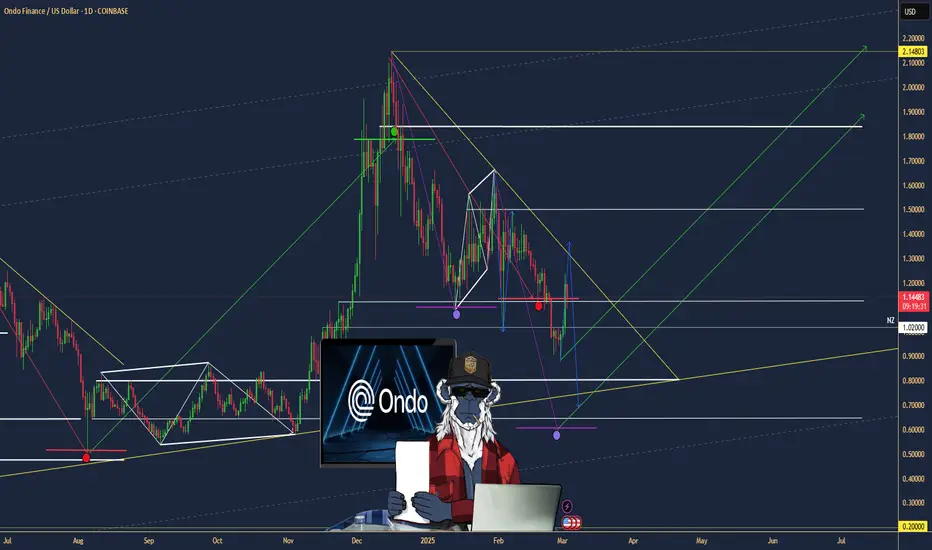
#Ondo Finance this is a possible scenario of how #ondo could play out this cycle if all goes well…. Not financial advice DCA safely

ONDOUSDTCryptocurrency Futures Market Disclaimer
Trading cryptocurrency futures involves high risks and is not suitable for all investors. Cryptocurrency prices are highly volatile, which can lead to significant gains or losses in a short period. Before engaging in crypto futures trading, consider your risk tolerance, experience, and financial situation.
Risk of Loss: You may lose more than your initial capital due to the leveraged nature of futures. You are fully responsible for any losses incurred.
Market Volatility: Crypto prices can fluctuate significantly due to factors such as market sentiment, regulations, or unforeseen events.
Leverage Risk: The use of leverage can amplify profits but also increases the risk of total loss.
Regulatory Uncertainty: Regulations related to cryptocurrencies vary by jurisdiction and may change, affecting the value or legality of trading.
Technical Risks: Platform disruptions, hacking, or technical issues may result in losses.
This information is not financial, investment, or trading advice. Consult a professional financial advisor before making decisions.
We are not liable for any losses or damages arising from cryptocurrency futures trading.
Note: Ensure compliance with local regulations regarding cryptocurrency trading in your region.

First share/ potential-possible-realisticIf cryptocurrencies like Bitcoin and tokenized assets gain reserve status post-tariff war (likely by 2026-2027), platforms like Ondo could experience significant growth.
1. -> jump on to the hyper bull run
Positive scenario (crypto reserves adopted): ONDO price could rise $3-$5 within the next few years, driven by institutional adoption and higher liquidity demand.
->possible steady walk towards the moon
Risk scenario (slow adoption): If crypto reserves are delayed, ONDO may stay in the $1.5-$2.5 range due to limited institutional involvement.
-> realistic bottom present scenario
Conclusion.
Short short short
Or
Long long long
Mexico is postponed
Canada/China and more to be resolved
War is on, a significant war.
Until it's over and clear,
Trimming is needed all across the globe.
1.38 target
0.92 target
0.72 misfortune
--->>
3.5 yes.

$ONDO - In big trouble!We still need to lose the green upsloping lines before confirmation, but looking at the complete market, I think it's set in stone.
LSE:ONDO 0.25$ is underway.

W's all day on ondo is it possible?Just seeing all these Ws wishful thinking but is it possible 🧐🤔? 15m to 1hour also showing W's

Ondo possible reversal?Just planning out ondo, keep in mind plans don't always play out... we will see in time.

ONDO Bullish Shark to T1 & Potential Bearish BatTicker: ONDO
Timeframe: Daily
Entry: 0.84887
Stop Loss: 0.76000
Take Profit: 1.386
R/R Ratio: 6.05
Pattern: Bullish Shark & Potential Bearish Bat
DOT: 1
HSI: 46
AmpRSI: 41
This bullish shark has held up during the last few months while we form a potential bearish bat with a C point at the terminal bar of the bullish shark. While HSI and AmpRSI are under the 50 it signals that we may spend more time down here. I added a stop under the terminal bar and structure low

ONDO (Daily) Elliot Wave ii UnderwayONDO appears to have completed a leading diagonal for wave 1 after finding a bottom at the major support high volume node (HVN).
Wave 2 has retraced to the expected alt coin Golden Pocket at the 78.6% retracement tapping high volume node.
The descending resistance line has been tested as support leaving a dragonfly doji but does not look strong enough to be the bottom yet.
Wave 3 should be a powerful move up.
This analysis is invalidated below macro wave 2 -$0.65
Safe trading

ONDO is at the start?In my view, ONDO is about to start it's even more stronger ascent. Re waves - it's my position that it is an expanding consolidation in the first period of coins existence and I am marking it as abcde, with likely f g h i to follow as in symmetrical pattern (symmetry in time and proportionality in structure can't be denied). But you can treat as some kind of expanding leading diagonal, like in obsolete EW, which imo is a structural crap if not in wave A (the only option and also doubtful). Risk\Return in this setup is quite attaractive.

Ondo Setup LSE:ONDO : Same setup. Same breakout.
Higher lows, perfect retest, triple confirmation.
The next leg could go vertical.
Are you in… or watching?

ONDOUSDT set up BUY LONG
potential to go up 📈
support
1.strong up daily
2.target resistance (line orange)

All I have to say about ONDO is 'own it!'ONDO has an incredibly bright future, and people are going to regret not owning it on a level rivaled only by Bitcoin.
Good luck, and always use a stop-loss!

Lord MEDZ Trading Outlook: ONDO
Not Financial Advice – Only for the Chosen Few.
Ah, ONDO. The markets speak if you know how to listen. While the crowd chases noise, we trace the hidden dealing ranges (DR) — and ONDO just whispered something divine from beneath the order block shadows.
After dancing along the Hidden DR zones (13131 & 39366) and retesting the golden Order Block, ONDO has carved a textbook accumulation structure. This isn't luck. It's precision. It's timing. It's Goldbach.
🧱 Support Holds:
The yellow Order Block has been respected with surgical precision. Price wicks, yes — but no bodies left behind. That’s respect. That’s a base. Lord MEDZ recognizes this foundation as a launchpad, not a landing.
🎯 Targets:
TP1: $1.82
▶️ A modest 107% move from current levels. This is your standard feast — for those who enter early and hold with conviction.
TP2: $3.48
▶️ A clean 298% move. This isn't just a moonshot. It's a calculated Goldbach projection, aligning with a liquidity magnet from the forgotten OB realms.
🧩 Confluence:
Hidden DR = ✓
Order Block Respect = ✓
Liquidity Void Above = ✓
Goldbach Alignment = Divine
This setup is dripping with institutional intent. Smart money doesn't chase; it waits. We don’t follow candles — we read the shadows.
If you see what I see, you already know...
“When they look left, we look through.” – Lord MEDZ
📊 Want more on the Goldbach projections?
Like, follow & comment. Let’s awaken more chart disciples.
We don’t trade trends.
We decode timelines.

ONDOUSD - Something big is comingThe price of ONDO is anticipated to experience an upward trend in the near future.
Something is brewing.
Bitcoin is primed for a big move.

ONDOUSDTDISCLAIMER:
what I share here is just personal research, all based on my hobby and love of speculation intelligence.
The data I share does not come from financial advice.
Use controlled risk, not an invitation to buy and sell certain assets, because it all comes back to each individual.

ONDOUSD | SPOT ONLYbuy in this area, price very discount % ONDO FINANCE
DISCLAIMER:
what I share here is just personal research, all based on my hobby and love of speculation intelligence.
The data I share does not come from financial advice.
Use controlled risk, not an invitation to buy and sell certain assets, because it all comes back to each individual.
#BTC #ONDO

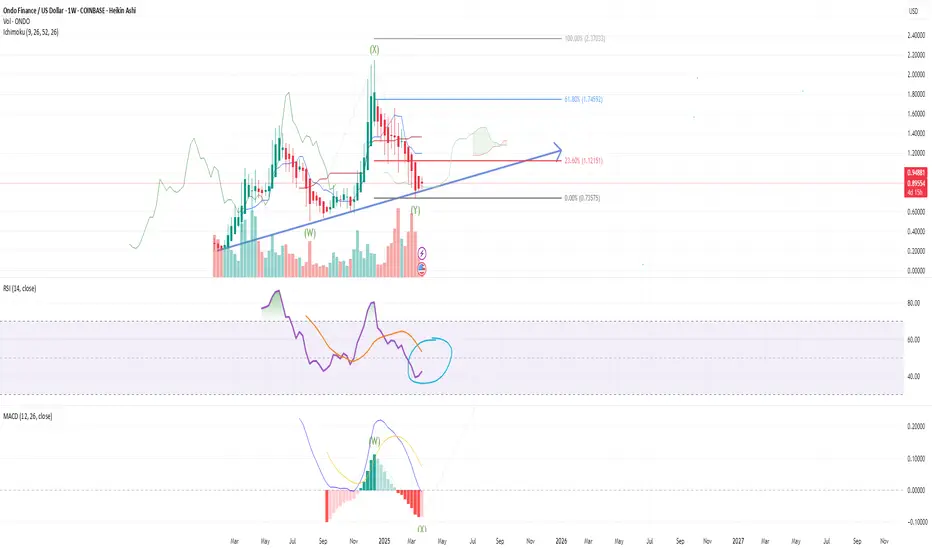
ONDO WXY 🟢 1. Overall Trend:
ONDO is still holding above a long-term ascending trendline (blue upward line), indicating the bullish structure remains intact.
The current price is testing this trendline, which acts as a strong support level.
🧠 2. Elliott Wave Structure:
The chart suggests a W-X-Y corrective wave pattern may have just completed or is close to completing.
The recent low labeled (Y) could potentially be the bottom before a new bullish wave begins.
☁️ 3. Ichimoku Cloud:
The price is currently near the Kumo cloud, indicating indecision or consolidation.
The Tenkan-Sen (red) and Kijun-Sen (blue) lines are close together, showing a lack of strong trend momentum for now.
A breakout above the cloud would signal a bullish reversal confirmation.
📊 4. Fibonacci Retracement Levels:
Price is near the 23.6% retracement level (~$1.12) from the previous top – a key resistance zone.
Higher resistance targets include 61.8% (~$1.74) and the 100% previous peak (~$2.37).
📉 5. RSI (Relative Strength Index):
Weekly RSI is around 42.39, not yet oversold but nearing the lower bound.
There's a possible bullish divergence forming and RSI is curving upward – a positive early signal.
📈 6. MACD (Moving Average Convergence Divergence):
MACD line has just crossed above the signal line, and the histogram is starting to turn green.
On the weekly timeframe, this crossover is a strong bullish reversal signal if confirmed in the following candles.
📊 7. Volume:
Volume has increased recently, especially near the trendline support, showing buyer interest at lower prices.
🧩 Conclusion:
Current key support: $0.89–$0.91 zone (along the ascending trendline).
As long as this support holds and RSI + MACD continue improving, ONDO may rebound toward the next resistance levels at $1.12, $1.74, and possibly $2.37.
If the price breaks below the trendline, the next major support lies near $0.73.

$ONDO: Ondo Finance – Tokenizing the Future or Facing Roadblocks
(1/9)
Good morning, champs! ☀️ LSE:ONDO : Ondo Finance – Tokenizing the Future or Facing RWA Roadblocks?
Ondo Finance just joined Mastercard’s Multi-Token Network, aiming to tokenize U.S. Treasuries! But with market volatility, is this RWA gem a buy or a wait? Let’s dive in! 🔍
(2/9) – PRICE PERFORMANCE 📊
• Recent Trend: Transaction volume spiked to 400M in Jan 2025, now ~300M 💰
• Market Insight: Up 1.6% recently (Daily Hodl, Feb 2025) 📏
• Sector: RWA tokenization surging with TradFi interest 🌟
It’s buzzing in the DeFi space! ⚙️
(3/9) – MARKET POSITION 📈
• Market Cap: Not specified; holds 40% of tokenized securities market 🏆
• Holdings: U.S. Treasuries, bonds via USDY, OUSG tokens ⏰
• Trend: Whales hold 88% of tokens, per IntoTheBlock 🎯
Firm, leading RWA tokenization! 🚀
(4/9) – KEY DEVELOPMENTS 🔑
• Partnership: Joined Mastercard MTN as first RWA provider (Feb 26, 2025) 🔄
• Expansion: Teamed with World Liberty Financial for RWAs 🌍
• Market Reaction: Steady growth in transaction volume 📋
Adapting, bridging TradFi and DeFi! 💡
(5/9) – RISKS IN FOCUS ⚡
• Volatility: Crypto market swings could hit token value 🔍
• Regulation: Compliance hurdles in tokenized assets 📉
• Concentration: High whale ownership (88%) risks dumps ❄️
Tough, but risks loom! 🛑
(6/9) – SWOT: STRENGTHS 💪
• RWA Leader: 40% tokenized securities market share 🥇
• Big Backers: BlackRock, Coinbase Ventures support 📊
• Tech Edge: Tokenizing U.S. Treasuries for DeFi 🔧
Got fuel in the tank! 🏦
(7/9) – SWOT: WEAKNESSES & OPPORTUNITIES ⚖️
• Weaknesses: High whale concentration, market volatility 📉
• Opportunities: TradFi integration, DeFi yield growth 📈
Can it tokenize to the moon? 🤔
(8/9) – 📢Transaction volume at 300M, Mastercard partnership live, your take? 🗳️
• Bullish: $2 soon, TradFi loves it 🐂
• Neutral: Steady, risks balance ⚖️
• Bearish: $0.90 looms, whales dump 🐻
Chime in below! 👇
(9/9) – FINAL TAKEAWAY 🎯
SMCI’s transaction volume and TradFi ties scream potential 📈, but whale concentration adds caution 🌿. Volatility’s our buddy—dips are DCA gold 💰. Grab ‘em low, climb like pros! Gem or bust?
ONDO appears to have a bright future ahead!ONDO is a favorite cryptocurrency of many investors and traders alike. The entire crypto market has been dragged down since December after the massive gains from the "Trump election pump" caused many cryptos to go ballistic. However, the future looks bright for ONDO, as the current weekly chart suggests it's setting up for another leg up.
Good luck, and always use a stop-loss!

$ONDO Back In Buying Territory - NEW ATHs on Q2ONDO is back in this buying zone.
I’ve been waiting to fill the wick, and it’s in the process—at least for 50%.
Stronger bids are sitting around 95 all the way down to 92, where I expect the price to trade above.
Should have plenty of time, as I see this consolidating until the end of April, so no rush.
LSE:ONDO BYBIT:ONDOUSDT
