Nikkei Futures Try for ATHsWith US President Trump finalizing an agreement with Japan by imposing a 15% tariff on US businesses for Japanese products, Japanese stocks are flying due to the new found competitive advantage they have
Related futures
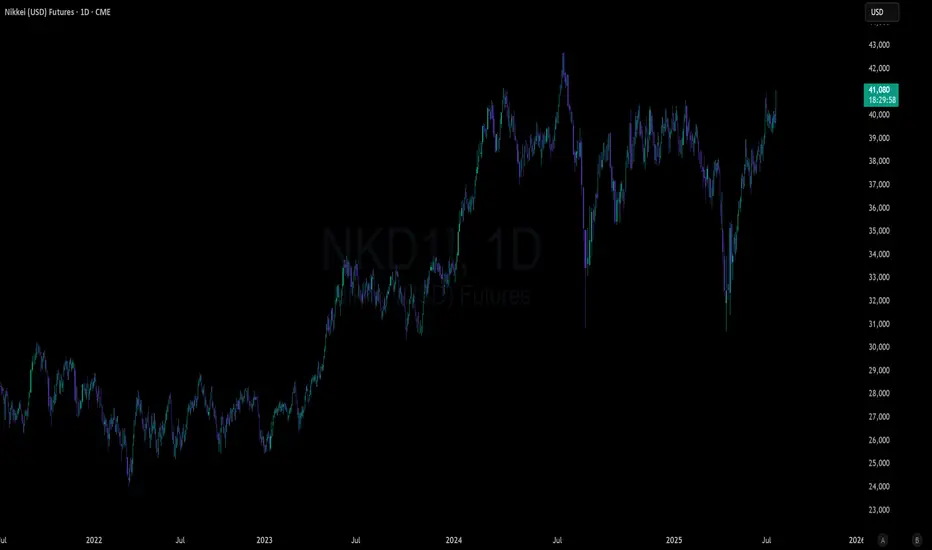

Japanese Yield Surged to Record High 3.2% - Nikkei OutlookAre Japanese markets still a buy after rising 170% since the pandemic, surpassing their roaring 1980s levels?
The reason why Japanese stocks have become some of the best-performing equities in Asia is largely due to the falling yen — a depreciation of around 60%. A weaker yen boosts Japan’s major e

Japanese Markets: Still a Buy?Are Japanese markets still a buy after rising 170% since the pandemic, surpassing their roaring 1980s levels?
The reason why Japanese stocks have become some of the best-performing equities in Asia is largely due to the falling yen — a depreciation of around 60%. A weaker yen boosts Japan’s major e

Nikkei 225 Wave Analysis – 21 May 2025
- Nikkei 225 reversed from the resistance level 38280.00
- Likely to fall to support level 36000.00
Nikkei 225 index recently reversed down from the pivotal resistance level 38280.00 (former top of wave 4 from the start of this year).
The downward reversal from the resistance level 66.00 created

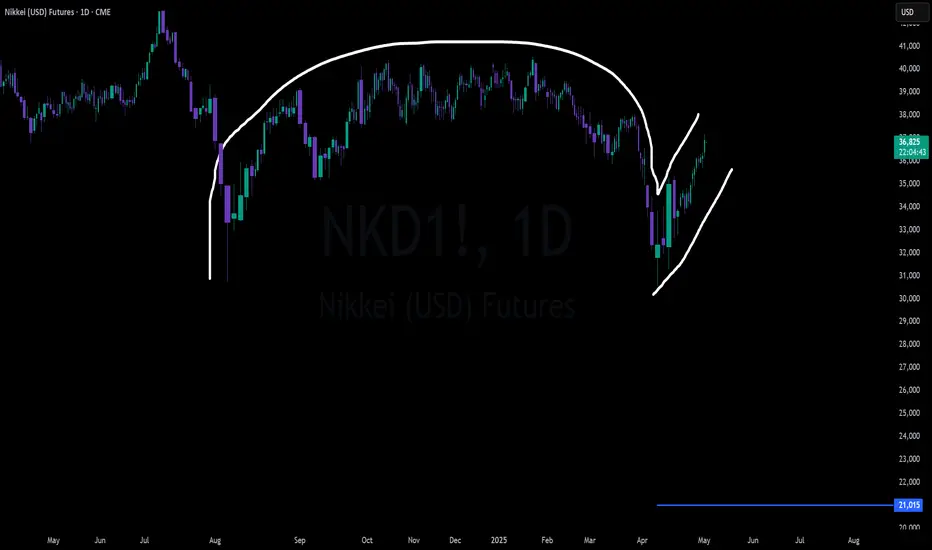
Nikkei Futures (NKD/Nikkei 225) Inverse Cup and HandleNikkei futures have setup an inverse cup and handle on the daily. A somewhat rare pattern as most of them turn into double bottoms or sideways consolidation. Maximum downside target for the pattern is 21,000
- Global macro trends continue to worsen
- BOJ stuck between saving the Yen and helping the
Nikkei 225 Bounce Zone Holds AgainTraders should pay close attention to Nikkei 225 futures if the price returns towards 30,400. We’ve now seen decent bounces from around that level five times, including earlier today upon the resumption of trade after the weekend.
While momentum signals are firmly bearish, with RSI (14) and MACD bo

The Nikkei (NKD) poised to continue its broader corrective trendThe Nikkei (NKD) has been trending lower since its peak on July 8, 2024. We indicate this decline follows a “double three” Elliott Wave pattern, characterized by a series of distinct movements. After reaching that high, the index fell to 30,720, rebounded to 40,675, and is now progressing downward i

classic wykoff distributionDropping as long as SP is dropping.
technicals are calling for 30k and 24k


See all ideas
Summarizing what the indicators are suggesting.
Neutral
SellBuy
Strong sellStrong buy
Strong sellSellNeutralBuyStrong buy
Neutral
SellBuy
Strong sellStrong buy
Strong sellSellNeutralBuyStrong buy
Neutral
SellBuy
Strong sellStrong buy
Strong sellSellNeutralBuyStrong buy
A representation of what an asset is worth today and what the market thinks it will be worth in the future.
Displays a symbol's price movements over previous years to identify recurring trends.
Frequently Asked Questions
The current price of Nikkei 225 Mini Futures is 38,985 JPY — it has fallen −1.86% in the past 24 hours. Watch Nikkei 225 Mini Futures price in more detail on the chart.
The volume of Nikkei 225 Mini Futures is 2.00. Track more important stats on the Nikkei 225 Mini Futures chart.
The nearest expiration date for Nikkei 225 Mini Futures is Jun 8, 2028.
Traders prefer to sell futures contracts when they've already made money on the investment, but still have plenty of time left before the expiration date. Thus, many consider it a good option to sell Nikkei 225 Mini Futures before Jun 8, 2028.
Open interest is the number of contracts held by traders in active positions — they're not closed or expired. For Nikkei 225 Mini Futures this number is 135.00. You can use it to track a prevailing market trend and adjust your own strategy: declining open interest for Nikkei 225 Mini Futures shows that traders are closing their positions, which means a weakening trend.
Buying or selling futures contracts depends on many factors: season, underlying commodity, your own trading strategy. So mostly it's up to you, but if you look for some certain calculations to take into account, you can study technical analysis for Nikkei 225 Mini Futures. Today its technical rating is neutral, but remember that market conditions change all the time, so it's always crucial to do your own research. See more of Nikkei 225 Mini Futures technicals for a more comprehensive analysis.