6/ Altseason: Live - Is this really the Altseason?12day Result I know this is the exact question you're asking yourselves as you look at your portfolios. "What altseason? Everything is flat."
Maybe I was wrong two weeks ago when I said it had already started. But, as they say, the result speaks for itself.
12 days ago, as part of the Altseason Live challen
Key data points
Previous close
—
Open
—
Day's range
—
About Crypto Total Market Cap Excluding Top 10, $
Looking at things from a different angle can always reveal an unexpected perspective. Take the crypto market — you all know Bitcoin, Ethereum and those other market leaders, but we promise, other coins take up a fair share of the market and hide endless opportunities too. To prove this point, we've removed the value of the top 10 coins and calculated the total market cap of the remaining crypto market — the result can be seen on the below chart. It might give you a hint of where the crypto market is moving, which is sometimes hard to see clearly with big players in the way.

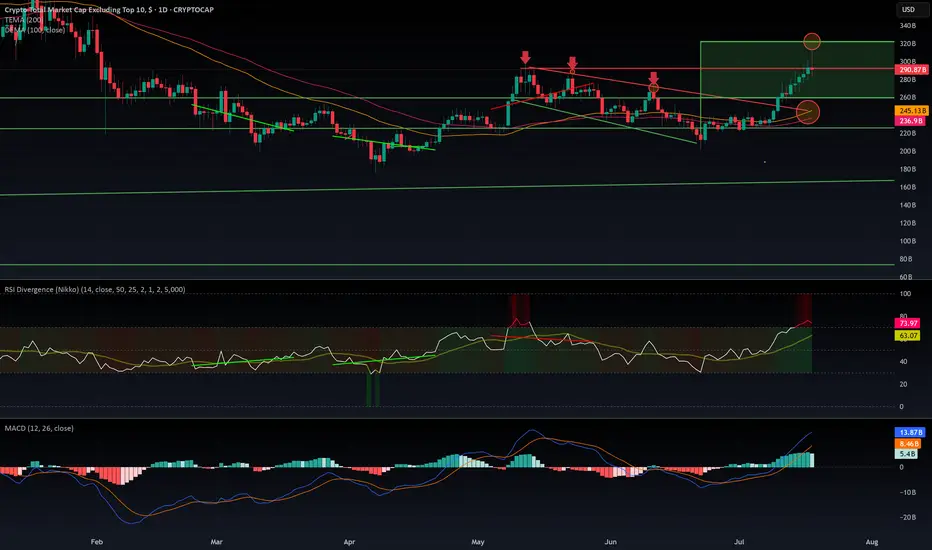
$OTHERS rejected from $320 B resistance. What is next?CRYPTOCAP:OTHERS Rejected at $320B: Is the Altseason on Pause?
CRYPTOCAP:OTHERS just got rejected at the $320B resistance after a decent pump — the kind that usually signals the start of an altseason. But if we dig into the indicators, warning signs are flashing:
- MACD is sitting in overbought
Altseason 2025 – EthseasonWe’ve officially entered #ETH season. Some liquidity is flowing into alts, but CRYPTOCAP:ETH has now taken the lead from CRYPTOCAP:BTC as the big dog.
Old retail is here and slowly buying this dip... but the new retail is nowhere to be seen, yet! Still positioning for that full-blown altseason

4/ Altseason: Live -The Final game is in September. My plan Altszn Live #4: My <50% Win Rate, the Psychology of Missed Profits, and the Endgame in September. Start with 10k
Let's be brutally honest. Running a public trading experiment comes with immense psychological pressure. This isn't a game. It's real money, real nerves, and a real reputation on the
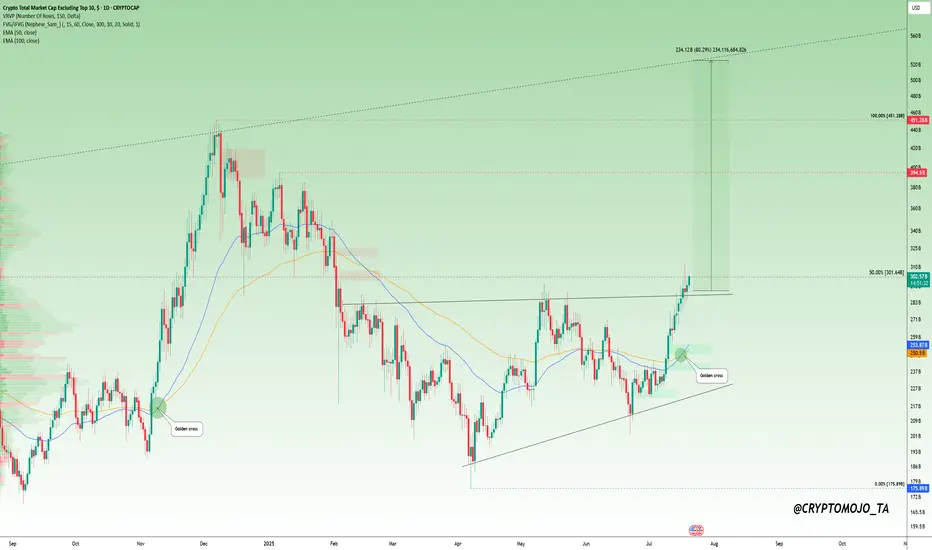
Altcoins Waking Up? Here’s What the Charts Are Telling Us!Altcoin Watch: Momentum Is Building!
A major shift is unfolding in the OTHERS chart, it just broke above its previous high and is on track to form a golden cross, a strong technical signal that often leads to a rally.
But here's the key: a confirmed breakout needs a solid close above the 50% retra
others \ btcOthers bitcoin pair has found support from the rising trend line since 2016 2017 and continues to recover

CRYPTO ALT SEASON One blue box, two different stories:
Above - Bull season
Below - Bear season
Not a financial advice

ALTcoin Market Outlook — Pivot Around Sept 15–22?This chart presents a detailed Ichimoku-based forecast for the altcoin market (Crypto Total Market Cap excluding top 10). Several technical and cyclical factors converge to suggest that mid-to-late September 2025 could mark a significant pivot high — potentially launching a strong move for alts.
🔹

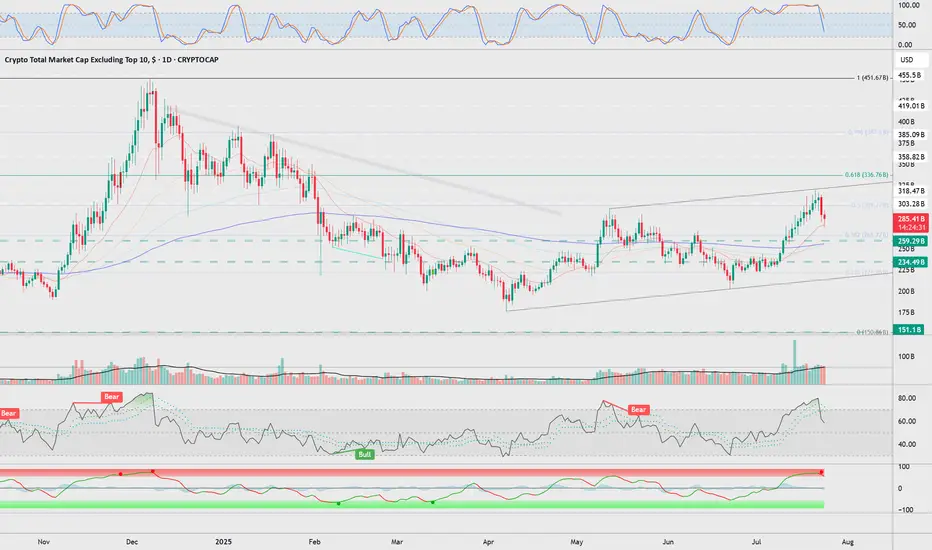
OTHERS my notes for short term230 & 260B should be strong supports. if it rises higher than 330B it'll be perfect for most of the altcoins, because it's 0,618 fib. it needs to pass that for altcoin season
not financial advices, notes for myself
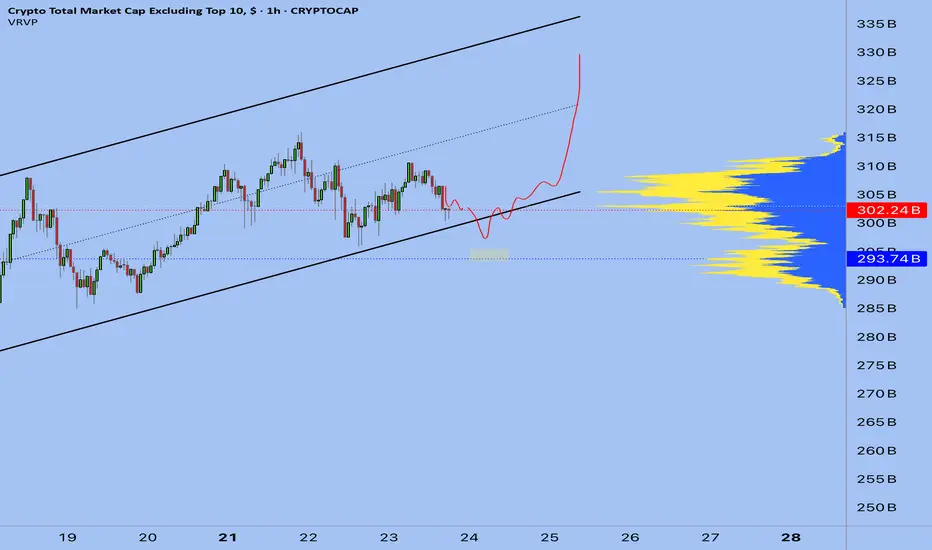
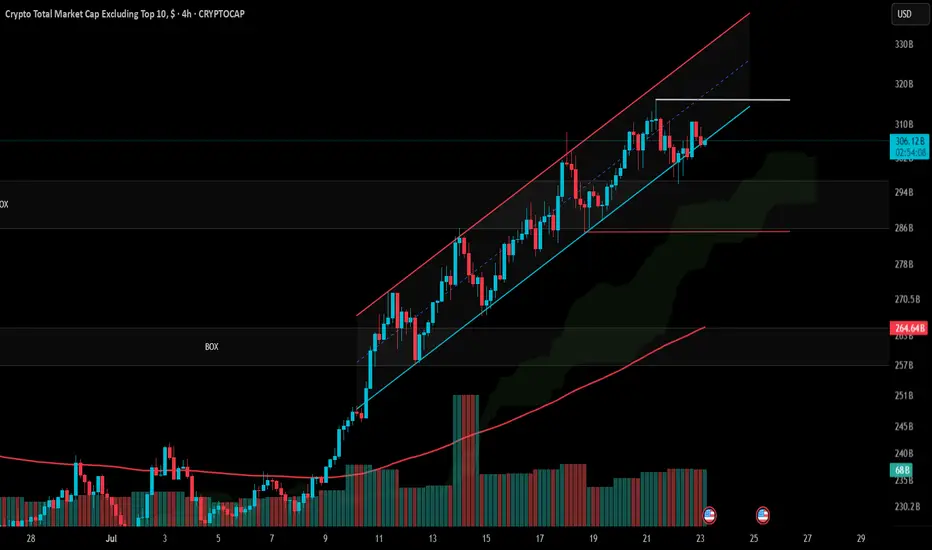
#Others Update #1 – July 23, 2025#Others Update #1 – July 23, 2025
The Others chart (crypto market cap excluding top 10) had been following a well-defined ascending channel. However, in recent candles, the price has started slipping below the lower boundary of this channel — a potentially bearish sign for altcoins.
Despite still
See all ideas
Summarizing what the indicators are suggesting.
Oscillators
Neutral
SellBuy
Strong sellStrong buy
Strong sellSellNeutralBuyStrong buy
Oscillators
Neutral
SellBuy
Strong sellStrong buy
Strong sellSellNeutralBuyStrong buy
Summary
Neutral
SellBuy
Strong sellStrong buy
Strong sellSellNeutralBuyStrong buy
Summary
Neutral
SellBuy
Strong sellStrong buy
Strong sellSellNeutralBuyStrong buy
Summary
Neutral
SellBuy
Strong sellStrong buy
Strong sellSellNeutralBuyStrong buy
Moving Averages
Neutral
SellBuy
Strong sellStrong buy
Strong sellSellNeutralBuyStrong buy
Moving Averages
Neutral
SellBuy
Strong sellStrong buy
Strong sellSellNeutralBuyStrong buy
Displays a symbol's price movements over previous years to identify recurring trends.