ABOTBullish Divergence:
The Relative Strength Index (RSI) at the bottom of the chart shows bullish divergence
This indicates potential upward momentum or trend reversal.
Safe Buying Zone:
The analyst suggests that buying is relatively safer near the lower boundary of the channel, where support has been
Next report date
—
Report period
—
EPS estimate
—
Revenue estimate
—
54.29 PKR
5.23 B PKR
68.18 B PKR
19.00 M
About ABBOTT LABORATORIES (PAKISTAN) LTD
Sector
Industry
CEO
Syed Anis Ahmed
Website
Headquarters
Karachi
Founded
1948
ISIN
PK0025701019
FIGI
BBG000BJ59C7
Abbott Laboratories (Pakistan) Ltd. engages in the manufacture, import, and marketing of pharmaceutical, nutritional, diagnostic, diabetes care, molecular devices, hospital, and consumer products. It operates through the following segments: Pharmaceutical, Nutritional, Diagnostics, and Others. The Pharmaceutical segment deals with the manufacture, import, and marketing of research based pharmaceutical products registered with the Drug Regulatory Authority of Pakistan. The Nutritional segment imports and markets pediatric nutritional products and medical nutritional products. The Diagnostics segment covers the import and marketing of diagnostic equipment, molecular devices, and testing kits. The Others segment represents the import and marketing of diabetes care products and manufacturing and marketing of general healthcare products. The company was founded on July 2, 1948 and is headquartered in Karachi, Pakistan.

ABOT longCurrently at a very good level.
Broke its all-time high and then came back to retest.
Golden cross about to happen on monthly TF.
Mov Avg 10 is also near, can come back to retest before jumping again but it can / cannot be the case always.
Next targets can be 1690 or 1700. Better to get out at 1650

ABOT Technical Analysis: Potential Bullish SetupABOT is showing a solid uptrend, currently holding within the 0.618-0.78 Fibonacci retracement zone—a key support area. It's respecting its trendline, and we're seeing bullish divergence in both volume and RSI, hinting at more buyers stepping in, which is a good sign. Plus, ABOT's fundamentals are s

ABOT - PSX - Monthly - LONG (BUY) Trade Call On monthly chart Crab harmonic pattern has been drawn. It is evident that in long run this SCRIPT is going to perform.
On Daily TF, price is above EMA 89 line and Klinger is also above zero with RSI indicator close to 70 mark with no divergence. Moreover, the last candle closed without any wick whic

Bullish Divergence on Weekly as well as Monthly TF.
Bullish on All Time Frames.
669 - 670 is an Important Level to Sustain.
If Sustained this level, we may witness 780 - 815
On the flip side, 557 - 560 is Important Support Zone.

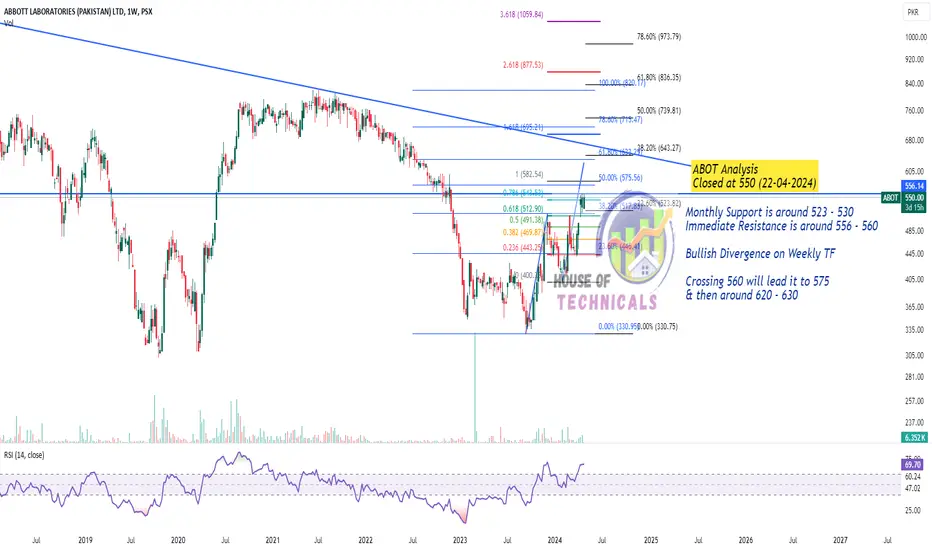
Bullish Divergence on Weekly TFMonthly Support is around 523 - 530
Immediate Resistance is around 556 - 560
Crossing 560 will lead it to 575
& then around 620 - 630
See all ideas
Summarizing what the indicators are suggesting.
Neutral
SellBuy
Strong sellStrong buy
Strong sellSellNeutralBuyStrong buy
Neutral
SellBuy
Strong sellStrong buy
Strong sellSellNeutralBuyStrong buy
Neutral
SellBuy
Strong sellStrong buy
Strong sellSellNeutralBuyStrong buy
An aggregate view of professional's ratings.
Neutral
SellBuy
Strong sellStrong buy
Strong sellSellNeutralBuyStrong buy
Neutral
SellBuy
Strong sellStrong buy
Strong sellSellNeutralBuyStrong buy
Neutral
SellBuy
Strong sellStrong buy
Strong sellSellNeutralBuyStrong buy
Displays a symbol's price movements over previous years to identify recurring trends.
Related stocks
Frequently Asked Questions
The current price of ABOT is 966.00 PKR — it has decreased by −1.21% in the past 24 hours. Watch ABBOTT LABORATORIES (PAKISTAN) LTD stock price performance more closely on the chart.
Depending on the exchange, the stock ticker may vary. For instance, on PSX exchange ABBOTT LABORATORIES (PAKISTAN) LTD stocks are traded under the ticker ABOT.
ABOT stock has fallen by −5.96% compared to the previous week, the month change is a −1.87% fall, over the last year ABBOTT LABORATORIES (PAKISTAN) LTD has showed a 30.54% increase.
ABOT reached its all-time high on Jan 15, 2025 with the price of 1,310.00 PKR, and its all-time low was 195.51 PKR and was reached on Jan 10, 2013. View more price dynamics on ABOT chart.
See other stocks reaching their highest and lowest prices.
See other stocks reaching their highest and lowest prices.
ABOT stock is 4.43% volatile and has beta coefficient of 1.22. Track ABBOTT LABORATORIES (PAKISTAN) LTD stock price on the chart and check out the list of the most volatile stocks — is ABBOTT LABORATORIES (PAKISTAN) LTD there?
Today ABBOTT LABORATORIES (PAKISTAN) LTD has the market capitalization of 92.98 B, it has decreased by −2.89% over the last week.
Yes, you can track ABBOTT LABORATORIES (PAKISTAN) LTD financials in yearly and quarterly reports right on TradingView.
ABBOTT LABORATORIES (PAKISTAN) LTD is going to release the next earnings report on Sep 3, 2025. Keep track of upcoming events with our Earnings Calendar.
ABOT net income for the last quarter is 1.60 B PKR, while the quarter before that showed 1.28 B PKR of net income which accounts for 24.49% change. Track more ABBOTT LABORATORIES (PAKISTAN) LTD financial stats to get the full picture.
Yes, ABOT dividends are paid annually. The last dividend per share was 10.00 PKR. As of today, Dividend Yield (TTM)% is 1.05%. Tracking ABBOTT LABORATORIES (PAKISTAN) LTD dividends might help you take more informed decisions.
ABBOTT LABORATORIES (PAKISTAN) LTD dividend yield was 0.81% in 2024, and payout ratio reached 18.70%. The year before the numbers were 0.00% and 0.00% correspondingly. See high-dividend stocks and find more opportunities for your portfolio.
As of Jun 20, 2025, the company has 1.41 K employees. See our rating of the largest employees — is ABBOTT LABORATORIES (PAKISTAN) LTD on this list?
EBITDA measures a company's operating performance, its growth signifies an improvement in the efficiency of a company. ABBOTT LABORATORIES (PAKISTAN) LTD EBITDA is 10.99 B PKR, and current EBITDA margin is 14.86%. See more stats in ABBOTT LABORATORIES (PAKISTAN) LTD financial statements.
Like other stocks, ABOT shares are traded on stock exchanges, e.g. Nasdaq, Nyse, Euronext, and the easiest way to buy them is through an online stock broker. To do this, you need to open an account and follow a broker's procedures, then start trading. You can trade ABBOTT LABORATORIES (PAKISTAN) LTD stock right from TradingView charts — choose your broker and connect to your account.
Investing in stocks requires a comprehensive research: you should carefully study all the available data, e.g. company's financials, related news, and its technical analysis. So ABBOTT LABORATORIES (PAKISTAN) LTD technincal analysis shows the sell today, and its 1 week rating is sell. Since market conditions are prone to changes, it's worth looking a bit further into the future — according to the 1 month rating ABBOTT LABORATORIES (PAKISTAN) LTD stock shows the buy signal. See more of ABBOTT LABORATORIES (PAKISTAN) LTD technicals for a more comprehensive analysis.
If you're still not sure, try looking for inspiration in our curated watchlists.
If you're still not sure, try looking for inspiration in our curated watchlists.