Trading opportunity for RENUSDTBased on technical factors there is a Buy position in :
📊 RENUSDT
🔵 Buy Now
🪫Stop loss 0.02470
🔋Target 0.03000
📏 R/R 2,5
💸RISK : 1%
We hope it is profitable for you ❤️
Please support our activity with your likes👍 and comments📝
RENUSDT trade ideas

RENUSDT Long Term Accumulation!!Ren’s Current Market Momentum:
Ren is showing a steady upward momentum, with the price currently at $0.04762, up 0.99% in the last 24 hours. The 24-hour trading volume has surged to $15.25M, a 17.84% increase, indicating robust market activity.
With a market cap of $47.59M and a circulating supply of 999.33M REN, the token shows continued potential for growth. Given the relatively stable FDV of $47.62M, Ren is positioned well for further price appreciation. The increased volume-to-market-cap ratio further signals growing interest and could indicate a continued upward trend for REN.
Key Details:
Price: $0.04762
Market Cap: $47.59M (+0.99% 1D)
24h Volume: $15.25M (+17.84%)
Fully Diluted Valuation (FDV): $47.62M
Volume to Market Cap Ratio (24h): 31.89%
Total Supply: 1,000,000,000 REN
Circulating Supply: 999.33M REN
What Is Ren (REN)?
Ren (REN) is an open-source protocol designed to enhance interoperability and liquidity between various blockchain platforms. By enabling seamless connections, Ren facilitates cross-chain transactions, allowing users to move assets across blockchains with ease.
Previously known as Republic Protocol, Ren launched its mainnet, RenVM (Ren Virtual Machine), in May 2020. This followed a successful $34 million ICO in 2018. The REN token serves as collateral for the network’s validators, called Darknodes, which help power the RenVM infrastructure.
Ren’s goal is to drive the accessibility of decentralized finance (DeFi) by breaking down the liquidity barriers between different blockchains.
What Makes Ren Unique?
Ren stands out as a versatile platform with numerous use cases, primarily focused on bridging the gaps that restrict DeFi growth. It allows DeFi projects to integrate assets from other blockchains, such as Bitcoin (BTC) and Zcash (ZEC), without relying on wrapped tokens like Wrapped Bitcoin (WBTC) or Wrapped Ethereum (WETH).
At its core, RenVM consists of a network of virtual computers, known as Darknodes, that operate the protocol. These Darknodes play a crucial role in maintaining the functionality of RenVM.
While Ren charges fees for its internal processes, these are typically paid to miners rather than contributing directly to the platform’s profitability. As an ERC-20 token, REN is also subject to gas fees, which help power transactions within the network.

REN/USDT – Increasing Buyers but Caution NeededThere’s a noticeable increase in buyer activity on BME:REN , suggesting growing interest. However, with the broader market showing signs of potential dumping, finding an optimal entry point remains challenging.
I’ve identified a few key buy zones to consider, with one being significantly lower in case the market experiences a deeper correction.
Key Observations:
Buyer Momentum: Increasing volume indicates accumulation, but confirmation is needed for a strong trend reversal.
Buy Zones: Multiple zones have been identified to balance risk and potential reward, including one very low zone as a contingency.
Market Context: Current market conditions lean bearish, so patience and disciplined entries are critical.
Strategy:
Wait for price action to reach one of the identified buy zones.
Look for confirmation signals (e.g., strong rejection wicks or bullish candlesticks) before entering.
Manage risk carefully, considering the volatile market environment.
Stay cautious and ready to adjust as the market evolves.
I keep my charts clean and simple because I believe clarity leads to better decisions.
My approach is built on years of experience and a solid track record. I don’t claim to know it all, but I’m confident in my ability to spot high-probability setups.
My Previous Analysis
🐶 DOGEUSDT.P: Next Move
🎨 RENDERUSDT.P: Opportunity of the Month
💎 ETHUSDT.P: Where to Retrace
🟢 BNBUSDT.P: Potential Surge
📊 BTC Dominance: Reaction Zone
🌊 WAVESUSDT.P: Demand Zone Potential
🟣 UNIUSDT.P: Long-Term Trade
🔵 XRPUSDT.P: Entry Zones
🔗 LINKUSDT.P: Follow The River
📈 BTCUSDT.P: Two Key Demand Zones
🟩 POLUSDT: Bullish Momentum
🌟 PENDLEUSDT: Where Opportunity Meets Precision
🔥 BTCUSDT.P: Liquidation of Highly Leveraged Longs
🌊 SOLUSDT.P: SOL's Dip - Your Opportunity
🐸 1000PEPEUSDT.P: Prime Bounce Zone Unlocked
🚀 ETHUSDT.P: Set to Explode - Don't Miss This Game Changer
🤖 IQUSDT: Smart Plan
⚡️ PONDUSDT: A Trade Not Taken Is Better Than a Losing One

REN/USDT: Approaching a Key Box Breakout on 2D TimeframeREN/USDT: Approaching a Key Box Breakout on 2D Timeframe
REN/USDT is edging closer to a critical breakout on the 2-day timeframe. The price has been consolidating within a defined box, creating mounting pressure for a potential move. A successful breakout above this zone could lead to a strong bullish rally.
Key insights:
- The 2D timeframe shows clear consolidation within the box, with the potential for significant movement upon a breakout.
- Confirmation is crucial—watch for a solid 2D candle close above the resistance level.
- A retest of the breakout zone as support can provide additional confirmation and a safer entry.
Stay cautious and follow your strategy to capitalize on this setup. As always, trade responsibly and ensure proper risk management.

Trading opportunity for RENUSDTBased on technical factors there is a Buy position in :
📊 RENUSDT
🔵 Buy Now
🪫Stop loss 0.03940
🔋Target 1 0.11111
🔋Target 2 0.16000
🔋Target 3 0.25000
💸RISK : 1%
We hope it is profitable for you ❤️
Please support our activity with your likes👍 and comments📝

#REN/USDT / Ready to go up#REN
The price is moving in a descending channel on the 4-hour frame and sticking to it well
We have a bounce from the lower limit of the descending channel, this support is at 0.03000
We have an uptrend, the RSI indicator is about to break, which supports the rise
We have a trend to stabilize above the moving average 100
Entry price 0.03585
First target 0.03885
Second target 0.04213
Third target 0.04716

REN, exhibiting a pepe-like pre-massive surge behavior. SEED!REN, is exhibiting some similar pre-massive-surge PEPE metrics based on its recent price behavior. This just means that we may see some exponential rise ahead in the next coming days.
This has waterfalled heavily from its peak glory after reaching a parabolic high of 1.8 to being pulled down weightily to extreme 0.030 levels.
Now, a long term shift has been registered based on recent metrics, and its a massive shift.
The consolidation has lasted for 2 years. Its been deprived for far too long.
But signs of awakening is being felt the last few days.
I have published PEPE before its multiple x era -- and this is exhibiting the same characteristics.
The current price range is an ideal seeding opportunity.
Spotted at 0.050
Target 10x and beyond.
TAYOR.
Trade with safety always.

REN BULL OR SCAM? ⚠️Rank 637 on CoinMarketCap, down by 98.5%. This asset has been significantly undervalued and forgotten. It’s not needed by anyone, but as always, the public is stuck in it. Interestingly, its Twitter account has 120,000 followers—not a lot, but still decent. The asset might get pumped significantly.
❗️Currently, we’ve dropped 33% below support from the previous high. If you look at it, it’s just a small dip. There's a new accumulation zone, but it’s within a descending channel, and the price is being squeezed toward a breakout of the trendline. I believe we’ll see a resolution by the end of the year.
📈Minimal targets are $0.13, which is a 300% gain from the current levels. On a bullish market, the asset could rise by as much as 1100% from this entry point. By the way, the price is now even lower than the ICO price — that's the state of this cryptocurrency!
✔️How should you trade it?
Don’t go into futures. The asset has already dropped deeply—going further down would be only for a scam.
You can start buying in a ladder strategy: the first purchase now, the second near support, and the third even lower—though it’s unlikely to drop further.
You can enter on a breakout. If you catch a false breakout, that will be your first entry, so it’s up to you to decide.

Next Big Move – Are You Ready?RENUSDT.P is flashing signals of a potential breakout, and the setup couldn’t be more exciting. With buyers stepping in at critical levels and momentum quietly building, this could be the start of something big. Two blue boxes can work as buyer area.
Why This Chart Stands Out:
🔑 Key Support Levels Holding: Buyers are defending crucial zones, laying the groundwork for a move upward.
📊 Potential Breakout Formation: The chart hints at a bullish pattern—watch closely for confirmation.
🔥 Volume Watch: A surge in volume could be the final signal that the breakout is here.
This could be a golden opportunity for traders seeking a high-reward play. Don't miss your chance to catch this move before it takes off!
I don’t clutter my charts with a mess of indicators that look like a toddler went wild with crayons. Clean, simple, and effective—that’s my style. Don’t believe me? Check out my hits below. 🎯
When it comes to trading, I’m all about confidence backed by experience. I’m not claiming to be the best (yet), but my results do most of the talking. Keep an eye on these levels—sometimes the charts quietly suggest what the markets will shout later. Let’s see how this ride unfolds together! 🚀
My Previous Hits
🐶 DOGEUSDT.P | 4 Reward for 1 Risk (or more if you’re bold).
DOGEUSDT.P: Next Move
🎨 RENDERUSDT.P | HTF Sniper Precision
RENDERUSDT.P: Opportunity of the Month
💎 ETHUSDT.P | Buyer Zone So Accurate You’ll Double Check
ETHUSDT.P: Where to Retrace
🟢 BNBUSDT.P | Buyer Zone Mastery (CZ vibes).
BNBUSDT.P: Potential Surge
📊 Bitcoin Dominance | Called it Like a Pro
BTC Dominance: Reaction Zone
🧑🎨 UNIUSDT.P | Long-Term Trade With Big Potential
UNIUSDT.P: Long-Term Trade
Now let’s see what the market has in store—it’s like watching a movie, but with charts and adrenaline! 🎬📈

Republic Protocol: Volume Activity Gives It Away (2,212% Or...)There are several patterns that give away the pairs that already hit bottom vs those that are still in risky waters.
➖ Those pairs that produced a small bullish wave between late 2023 and early 2024, tend to be have a stronger footing right now vs those that grew massively.
➖ Those pairs hitting new major lows followed by an increase in trading activity, look stronger for immediate bullish action vs those that are trading pretty high.
Here we have Republic Protocol vs Tether (RENUSDT). The trading volume gives it away.
We have a more than four years long higher low, that is, March 2020 (low) vs August 2024 (higher low).
Notice the rise in volume after July 2023. And specially the volume on the 5-August weekly session; this candle produced the highest volume ever.
The lowest price in four and a half years, yet the candle closed green and high activity is present recently.
These signals can indicate that this pair is ready to turn. We have a long-term higher low and this pair also looks bullish on its BTC side.
If any doubts remain that the bottom is in, look at the linear chart.
With that said, there can be shakeouts and even a lower low wick, but this wouldn't change the potential for growth in the coming months and in 2025.
We are not looking at new ATH projections and potential in this trade-idea but this is possible in 2025, because of the chart structure.
We can revisit again in the future once we are closer to the next market cycle, the 2025 full-blown bull-market.
Thank you for reading.
Namaste.

Ren/UsdtBINANCE:RENUSDT
REN is in a strong uptrend, with the key levels being $0.0620 - $0.0630 / 0.0874 for resistance and $0.5300 - $0.5000 for support. If the price respects these levels, there could be further upside potential in the market.
Reminder:
This analysis is based on current market conditions. Always be mindful of potential risks and manage your trades accordingly.

Finally ren is ready for massive breakout seems like ren is finally ready for solid recovery on verge of falling wedge + key horizontal area incase of successful breakout expecting move like doge in coming days after successful breakout expecting 200 to 250% bullish rally

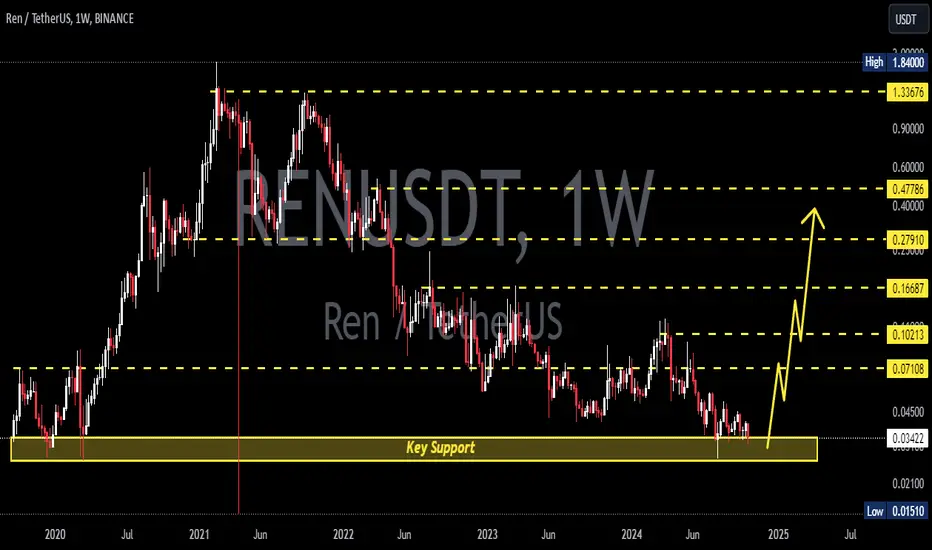
RENUSDTREN ~ 1W
#REN Do you have Conviction on this Coin?,. If yes,. This is a very good price to start buying again.
DreamAnalysis | REN Futures Key Triggers and Levels✨ Welcome to today’s analysis! Today, I’ll be reviewing REN and identifying crucial futures trading triggers for this coin. We’ll start with the daily timeframe and then move to the 4-hour timeframe for more detailed insights.
📅 Daily Timeframe Analysis
In the daily timeframe, REN has been in a prolonged downtrend since hitting resistance at $0.11457, a decline that has continued for almost 200 days. Currently, the price is at the $0.03268 support, which is the most critical level for this coin. Although this support is robust, repeated encounters with this level have gradually weakened it, having already been tested four times in this cycle.
🔽 If this support fails, the price may move to the next support level at $0.02839. This is the last major support, and a loss here would likely lead to sharp, deep drops on the chart.
🔼 If the price rebounds from support, the first long trigger will be a break above the trendline and $0.03924, followed by a second trigger at $0.04436. Both are risky triggers, so I rely on volume and RSI confirmation before entering positions. (While volume and RSI are essential in all trades, they are even more critical in higher-risk positions.)
📊 Currently, volume is stagnating, showing no clear momentum. If $0.03268 breaks, high selling volume will confirm the breakout; otherwise, it could likely be a false break. For a long position, a strong increase in buying volume is necessary to change the trend.
📈 The primary long trigger is a break above $0.05437, a significant support level for this coin, which can also serve as a spot buy trigger. An RSI break above 58.61 would indicate a bullish momentum. Spot targets include resistance levels at $0.08088 and $0.11457.
⏳ 4-Hour Timeframe Analysis
In this timeframe, we can refine the $0.03268 support to $0.03385, where a breakdown has already occurred, followed by a potential pullback. If the pullback confirms and the price sets a lower high, the support breakdown will be valid, setting $0.02839 as the next target.
📉 One noteworthy detail in this downtrend is that volume is decreasing; however, as today is Saturday, reduced volume is typical across markets, so it’s not necessarily a sign of weakness. Additionally, RSI is near the 30 mark, and a break below could introduce bearish momentum, pushing the price toward the next target if the pullback confirms.
📈 However, if this breakdown proves false and the price reenters the $0.03385 to $0.03963 box, it indicates that buyers have stepped in, pushing the price back up despite the support break. In that case, we can anticipate a bullish move, and a break above the $0.03963 resistance could be a long trigger. A riskier long trigger would be a break above the 50 line in RSI, along with a higher high in Dow Theory. All of these triggers will only be valid if the price reverses the downtrend and reenters the box.
❌Disclaimer
This is not financial advice; it is merely my personal opinion on how the coin might move. Always conduct your own research before making any decisions.

RENUSDT 1:1 Long Setup SettingBINANCE:RENUSDT
CRYPTO:RENUSD
SL1 ---> Low-risk status: 3x-4x Leverage
SL2 ---> Mid-risk status: 5x-8x Leverage
👾The setup is active but expect the uncertain phase as well.
➡️Entry Area:
Yellow zone
⚡️TP:
0.03480
0.03530
0.03603
0.03693
🔴SL:
0.03163
🧐The Alternate scenario:
If the price stabilizes below the trigger zone, the setup will be cancelled.

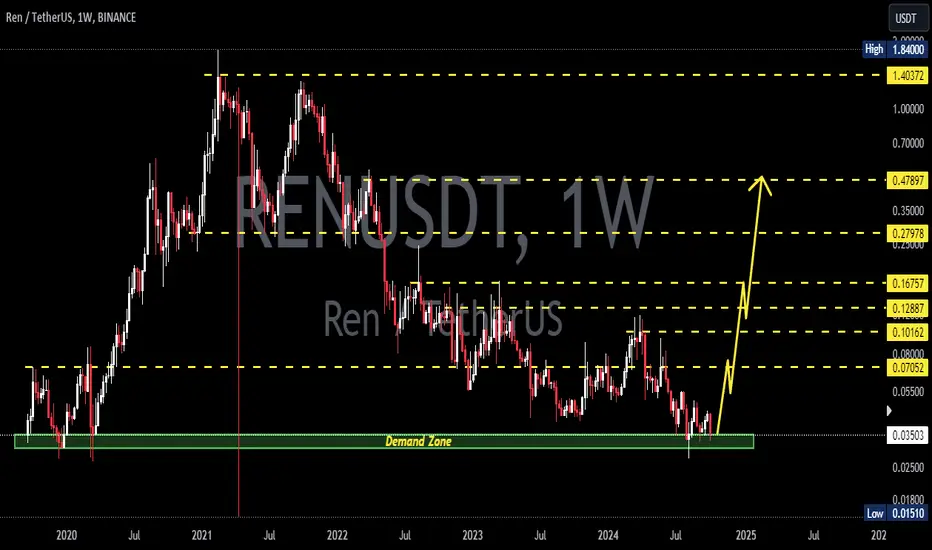
RENUSDTREN ~ 1W ✅
#REN Do you have Conviction on this Coin?,. If yes,. This is a very good price to start buying again.
#REN/USDT#REN
The price has broken the descending channel on the 1-day frame upwards and is expected to continue
We have a trend to stabilize above the moving average 100 again
We have an upward trend on the RSI indicator that supports the rise by breaking it upwards
We have a support area at the lower limit of the channel at a price of 0.03350
Entry price 0.04250
First target 0.05190
Second target 0.06400
Third target 0.07530

RENUSDT.1DThe REN/USDT technical analysis chart on TradingView illustrates the current market dynamics for Ren against the US Dollar Tether on a daily timeframe. The chart marks two resistance levels at $0.03203 (R1) and $0.05518 (R2), with a support level at $0.02303 (S1).
From the chart, it appears that REN/USDT has been in a consolidation phase, trading within a descending triangle pattern, typically considered a bearish formation in technical analysis. However, the recent price action shows an attempt to break out from this pattern, heading towards resistance level R1.
Technical Indicators:
Stochastic RSI: Currently, the Stochastic RSI is nearing the overbought territory, suggesting that the price might soon face downward pressure if traders start taking profits.
MACD: The MACD is close to crossing above the signal line, indicating a possible bullish momentum in the short term. However, the histogram remains very close to zero, suggesting that the upward momentum might not be very strong.
Analysis and Trading Strategy: Given the proximity to R1 and the potential bullish crossover in MACD, there might be an opportunity for a short-term bullish trade. If REN/USDT successfully breaches R1, the next target would be R2, which would confirm a stronger bullish sentiment.
Bullish Scenario: If REN/USDT breaks and holds above R1 at $0.03203, consider taking a long position with a target at R2 ($0.05518). Place a stop-loss just below R1 to protect the trade against a reversal.
Bearish Reversal: Should the price fail to maintain its position above R1 or if the Stochastic RSI reverses from the overbought condition, it could indicate a pullback towards S1 at $0.02303. In this scenario, a short position could be considered, placing a stop-loss just above the recent high.
Conclusion: While the short-term indicators suggest bullish potential, the overall pattern and market conditions require cautious trading. The descending triangle pattern should not be ignored as it traditionally signals bearish trends. It is essential to monitor the price action closely at R1 and adjust positions accordingly. Additionally, any external market influences or fundamental news related to Ren should be considered as they can significantly affect price movements. As always, maintaining proper risk management protocols is critical to safeguard investments from unexpected market movements.

RENUSDTREN ~ 1W
#REN Do you have Conviction on this Coin?,. If yes,. This is a very good price to start buying again.

REN Technical Analysis in a 3-Day TimeframeHello everyone, I’m Cryptorphic.
I’ve been sharing insightful charts and analysis for the past seven years.
Follow me for:
~ Unbiased analyses on trending altcoins.
~ Identifying altcoins with 10x-50x potential.
~ Futures trade setups.
~ Daily updates on Bitcoin and Ethereum.
~ High time frame (HTF) market bottom and top calls.
~ Short-term market movements.
~ Charts supported by critical fundamentals.
Now, let’s dive into this chart analysis:
REN is in a downtrend, and a few weeks ago, it was rejected at the 35 EMA resistance. If the bearish move continues, REN is likely to test the descending support trendline at around $0.0277.
The RSI is forming a hidden bearish divergence, indicating a potential bearish impact on REN.
If REN holds above the support trendline, a rebound can be expected, with the price testing the $0.052 resistance.
Key levels:
- Support/Entry: $0.0277.
- Primary Resistance: $0.048-$0.052.
- Higher Resistance: $0.095.
- RSI: Hidden bearish divergence formation.
DYOR, NFA.
Please hit the like button to support my content and share your thoughts in the comment section. Feel free to request any chart analysis you’d like to see!
Thank you!
#PEACE

Is #RENUSDT About to Skyrocket or Sink? Key Levels in FocusYello, Paradisers! Are you ready for the next big move on #RENUSDT? Let's look at the latest analysis of the #REN and see what's happening:
💎We're seeing some strong potential for a bullish continuation from a critical demand zone at $0.0343. We've been closely tracking #REN, which follows a descending channel pattern and seems to be gearing up for a bullish breakout. The next key target to watch after the breakout is the internal minor resistance at $0.059.
💎If #REN holds steady at $0.0343, we could be on the brink of a significant bullish rally, much like those explosive moves we've seen before. A breakout above the crucial resistance at $0.059 could pave the way for a run toward even higher resistance zones—with potential gains ready to take us even further.
💎But caution, Paradisers! If momentum weakens at this critical demand zone, we might see a pullback to the lower support area around $0.0276.
💎Keep your eyes on #REN price action. A daily close below this support could invalidate the bullish scenario and open the door to further declines.
Stay focused, patient, and disciplined Paradisers.
MyCryptoParadise
iFeel the success🌴

RENUSDTREN ~ 1W ✅
#REN Do you have Conviction on this Coin?,. If yes,. This is a very good price to start buying again.

RENUSDT ANALYSIS PAIR : BYBIT:RENUSDT.P
Leverage: 5X
Direction: LONG 🔼
SL: HODL
TP: 0.0500
ANALYSIS:
Market Cypher B: 1D TF✅
Bull Bear Power: 5HR TF✅
Nearest Resistance: 0.0500
Nearest Support: 0.03400
⚠️#DYOR
