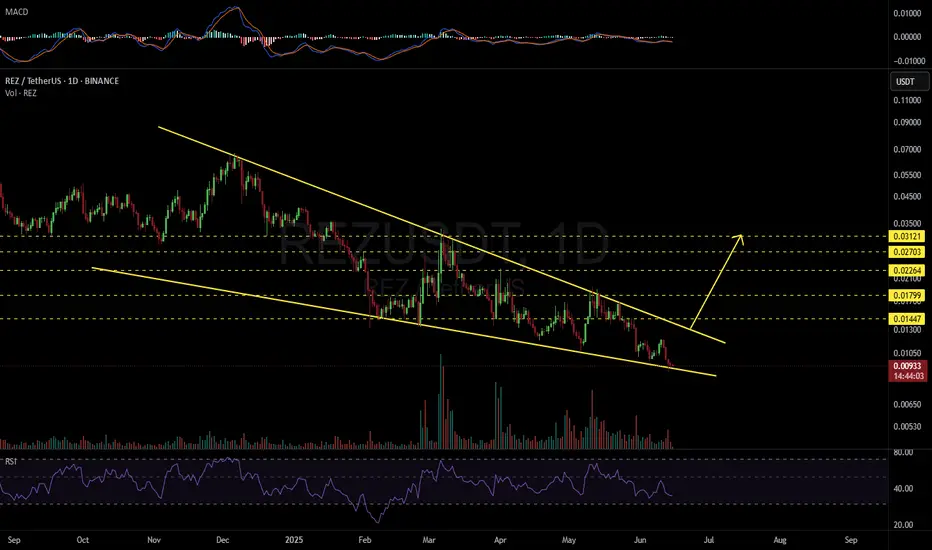
REZUSDT 1D#REZ — Bounce Incoming? 🔄
#REZ is currently sitting on the falling wedge support on the daily chart — a potential reversal zone.
If the price breaks out above the wedge resistance, the next upside targets are:
🎯 $0.01447
🎯 $0.01799
🎯 $0.02264
🎯 $0.02703
🎯 $0.03121
⚠️ Always use a tight stop-loss
Related pairs
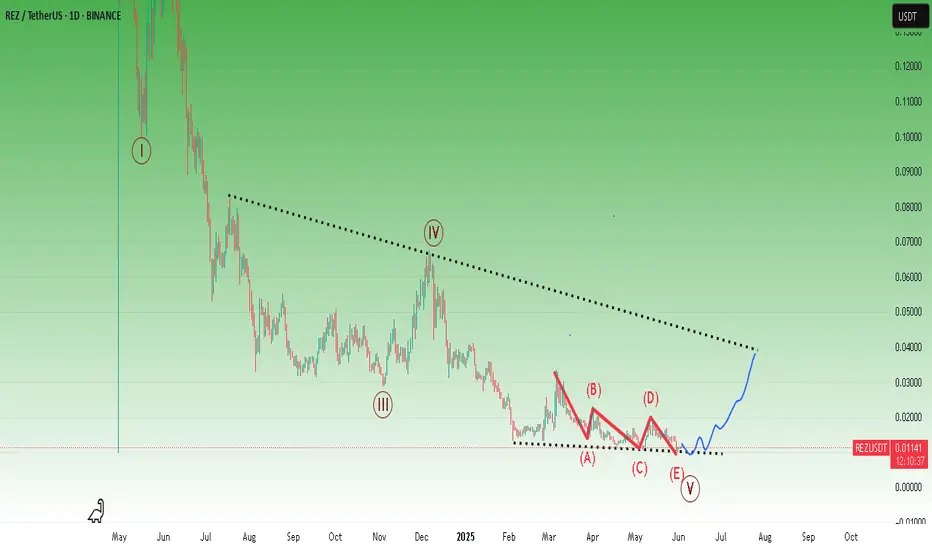
REZThis coin, which has been falling for a long time, may now react from these levels. Because it may be towards the end of both long-term and short-term downward waves. Ethereum staking news to watch out for.
* The purpose of my graphic drawings is purely educational.
* What i write here is not an in
REZUSDT 1D AnalysisREZ ~ 1D Analysis
#REZ Buy again from here if you still have confidence in this coin with a short term target of at least 15%+

REZUSDT UPDATE
Pattern: Falling Wedge Breakout
Current Price: \$0.01125
Target Price: \$0.02675
Target % Gain: 151%
Technical Analysis: REZ has broken out of a falling wedge on the 1D chart with a bullish retest, suggesting reversal momentum. The breakout is clean, indicating potential for a 151% move if volu

This Hidden Altcoin Could Explode—But Only If THIS Level Holds!Yello Paradisers, have you seen what’s quietly brewing on REZUSDT? A high-probability bullish reversal setup is forming, and if this level holds, it could lead to one of the cleanest altcoin plays we’ve seen recently. This isn’t just about one signal—REZUSDT is showing a rare confluence of bullish i

REZ/USDT – Potential Reversal from Tweezer Bottom | 1H Chart AnaREZ is showing early signs of a trend reversal on the 1-hour chart after forming a Tweezer Bottom pattern near a support zone. This pattern, combined with a bullish RSI divergence and a break of the downtrend line, suggests a possible shift in momentum.
🔹 Entry Price: $0.01378
🔹 Stop Loss: $0.01310

REZ/USDT next 100-200% ??After a prolonged downtrend over the past year, REZ is showing early signs of a potential trend reversal. The recent price action is forming a solid Support , suggesting accumulation and preparation for a breakout.
Target 1: $0.17
Target 2: $0.20
Target 3: $0.26
Potential target : $ 0.36
SL: $

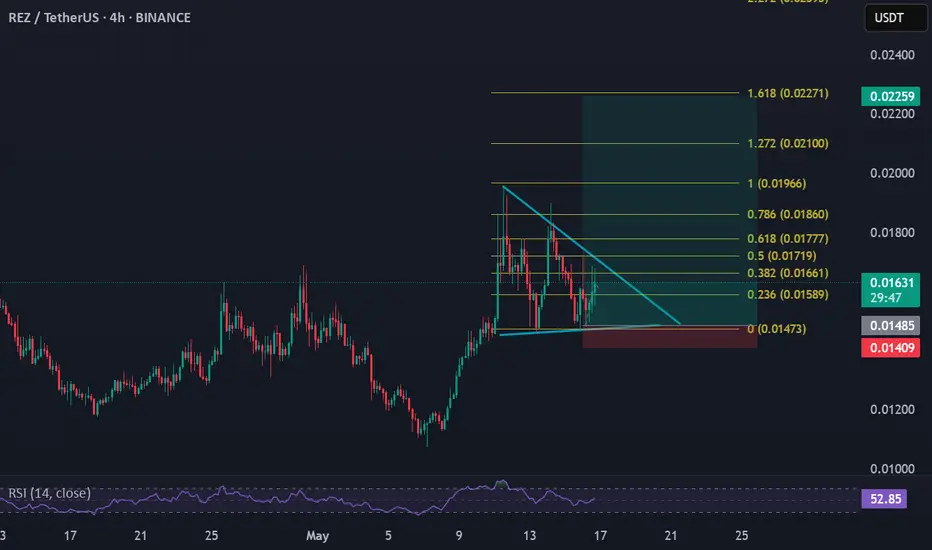
$REZ Reversal in Motion – Eyes on the Next Wave UpAMEX:REZ reversed major resistance into support upon coming out of a downtrend.
We are currently looking for a pullback towards the 0.618 Fib level at 0.015 before the next wave up.
The market structure is still bullish, and the chart is priming for an explosive breakout into $0.023+.
Keep alert

Waiting to explode $REZUSDTContinuation triangle for breakout BINANCE:REZUSDT ,
SL & Tp look at the chart
REZ 3D Setup – Classic Reversal Pattern in Play🔥 REZ – 3D Setup on Watch
📉 REZ is shaping up a falling wedge on the 3-day chart—a well-known bullish reversal pattern 🔍
A breakout from this structure could trigger strong upside momentum 🚀
👀 Keep this on your radar—the higher timeframe setup is starting to heat up!

See all ideas
Summarizing what the indicators are suggesting.
Oscillators
Neutral
SellBuy
Strong sellStrong buy
Strong sellSellNeutralBuyStrong buy
Oscillators
Neutral
SellBuy
Strong sellStrong buy
Strong sellSellNeutralBuyStrong buy
Summary
Neutral
SellBuy
Strong sellStrong buy
Strong sellSellNeutralBuyStrong buy
Summary
Neutral
SellBuy
Strong sellStrong buy
Strong sellSellNeutralBuyStrong buy
Summary
Neutral
SellBuy
Strong sellStrong buy
Strong sellSellNeutralBuyStrong buy
Moving Averages
Neutral
SellBuy
Strong sellStrong buy
Strong sellSellNeutralBuyStrong buy
Moving Averages
Neutral
SellBuy
Strong sellStrong buy
Strong sellSellNeutralBuyStrong buy
Displays a symbol's price movements over previous years to identify recurring trends.
Frequently Asked Questions
The current price of REZ / TetherUS (REZ) is 0.00830 USDT — it has fallen −1.11% in the past 24 hours. Try placing this info into the context by checking out what coins are also gaining and losing at the moment and seeing REZ price chart.
REZ / TetherUS price has fallen by −3.25% over the last week, its month performance shows a −41.37% decrease, and as for the last year, REZ / TetherUS has decreased by −90.75%. See more dynamics on REZ price chart.
Keep track of coins' changes with our Crypto Coins Heatmap.
Keep track of coins' changes with our Crypto Coins Heatmap.
REZ / TetherUS (REZ) reached its highest price on Apr 30, 2024 — it amounted to 0.29890 USDT. Find more insights on the REZ price chart.
See the list of crypto gainers and choose what best fits your strategy.
See the list of crypto gainers and choose what best fits your strategy.
REZ / TetherUS (REZ) reached the lowest price of 0.00758 USDT on Jun 21, 2025. View more REZ / TetherUS dynamics on the price chart.
See the list of crypto losers to find unexpected opportunities.
See the list of crypto losers to find unexpected opportunities.
The safest choice when buying REZ is to go to a well-known crypto exchange. Some of the popular names are Binance, Coinbase, Kraken. But you'll have to find a reliable broker and create an account first. You can trade REZ right from TradingView charts — just choose a broker and connect to your account.
Crypto markets are famous for their volatility, so one should study all the available stats before adding crypto assets to their portfolio. Very often it's technical analysis that comes in handy. We prepared technical ratings for REZ / TetherUS (REZ): today its technical analysis shows the sell signal, and according to the 1 week rating REZ shows the sell signal. And you'd better dig deeper and study 1 month rating too — it's neutral. Find inspiration in REZ / TetherUS trading ideas and keep track of what's moving crypto markets with our crypto news feed.
REZ / TetherUS (REZ) is just as reliable as any other crypto asset — this corner of the world market is highly volatile. Today, for instance, REZ / TetherUS is estimated as 1.93% volatile. The only thing it means is that you must prepare and examine all available information before making a decision. And if you're not sure about REZ / TetherUS, you can find more inspiration in our curated watchlists.
You can discuss REZ / TetherUS (REZ) with other users in our public chats, Minds or in the comments to Ideas.