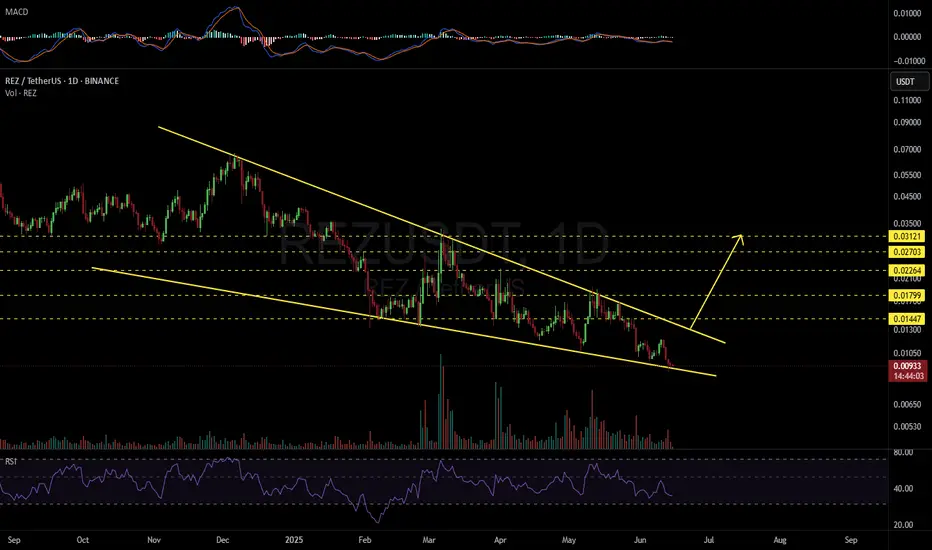
REZUSDT 1D#REZ — Bounce Incoming? 🔄
#REZ is currently sitting on the falling wedge support on the daily chart — a potential reversal zone.
If the price breaks out above the wedge resistance, the next upside targets are:
🎯 $0.01447
🎯 $0.01799
🎯 $0.02264
🎯 $0.02703
🎯 $0.03121
⚠️ Always use a tight stop-loss to manage risk and protect your capital.
REZUSDT trade ideas
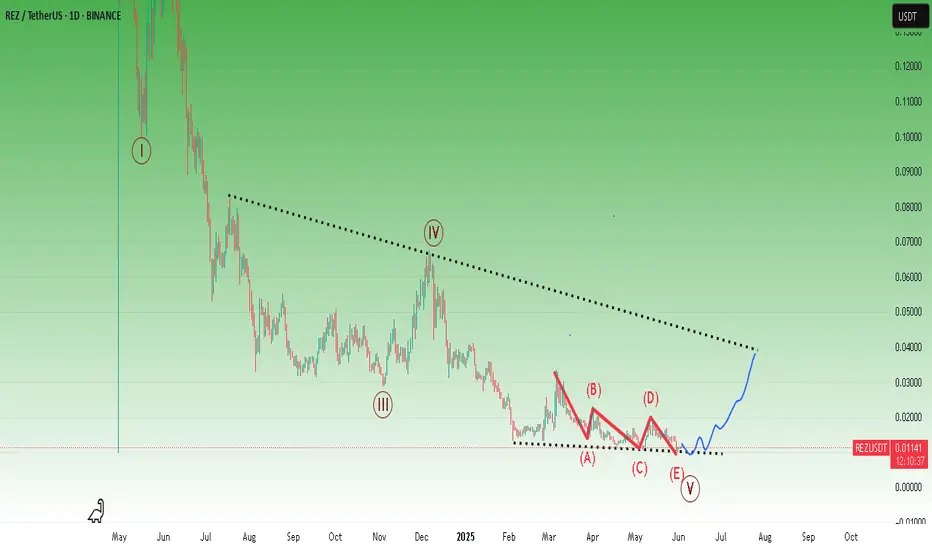
REZThis coin, which has been falling for a long time, may now react from these levels. Because it may be towards the end of both long-term and short-term downward waves. Ethereum staking news to watch out for.
* The purpose of my graphic drawings is purely educational.
* What i write here is not an investment advice. Please do your own research before investing in any asset.
* Never take my personal opinions as investment advice, you may lose your money.
REZUSDT 1D AnalysisREZ ~ 1D Analysis
#REZ Buy again from here if you still have confidence in this coin with a short term target of at least 15%+

REZUSDT UPDATE
Pattern: Falling Wedge Breakout
Current Price: \$0.01125
Target Price: \$0.02675
Target % Gain: 151%
Technical Analysis: REZ has broken out of a falling wedge on the 1D chart with a bullish retest, suggesting reversal momentum. The breakout is clean, indicating potential for a 151% move if volume confirms.
Time Frame: 1D
Risk Management Tip: Always use proper risk management.

This Hidden Altcoin Could Explode—But Only If THIS Level Holds!Yello Paradisers, have you seen what’s quietly brewing on REZUSDT? A high-probability bullish reversal setup is forming, and if this level holds, it could lead to one of the cleanest altcoin plays we’ve seen recently. This isn’t just about one signal—REZUSDT is showing a rare confluence of bullish indicators that deserve your full attention.
💎Currently, REZUSDT is moving within a descending channel while printing a bullish divergence on momentum indicators. At the same time, a textbook W-pattern has just formed, and what makes this even more significant is that it’s happening right at a support zone. This triple confluence—descending channel, bullish divergence, and W-pattern at support—is increasing the probability of a bullish breakout in the coming sessions.
💎From an entry perspective, those looking for more favorable risk-to-reward (RR) could benefit from a deeper pullback. That would offer a higher probability setup and tighter risk management. However, for aggressive or short-term traders, the current level still offers a 1:1 RR, which, while not optimal, is acceptable under strict trade management and position sizing.
💎That said, there’s a critical invalidation point that must be respected. If the price breaks down and closes a full candle below the support zone, it would invalidate the entire bullish structure. In such a case, the only professional move is to stay out and wait for cleaner confirmation or a better-developed setup. There is no room for hope in trading—only strategy and discipline.
🎖Strive for consistency, not quick profits. Trade smart, Paradisers. This setup could be a gift for the patient and a trap for the impulsive. The key is always the same—discipline, patience, and strategic execution. Stay sharp, stay focused, and keep protecting your capital.
MyCryptoParadise
iFeel the success🌴

REZ/USDT – Potential Reversal from Tweezer Bottom | 1H Chart AnaREZ is showing early signs of a trend reversal on the 1-hour chart after forming a Tweezer Bottom pattern near a support zone. This pattern, combined with a bullish RSI divergence and a break of the downtrend line, suggests a possible shift in momentum.
🔹 Entry Price: $0.01378
🔹 Stop Loss: $0.01310
🔹 TP-1: $0.01467
🔹 TP-2: $0.01559
✅ RSI is showing bullish divergence, indicating weakening selling pressure.
📌 Traders can watch for volume confirmation and manage risk accordingly. As always, take-profit levels can be adjusted depending on your individual risk-reward ratio or trade management plan.

REZ/USDT next 100-200% ??After a prolonged downtrend over the past year, REZ is showing early signs of a potential trend reversal. The recent price action is forming a solid Support , suggesting accumulation and preparation for a breakout.
Target 1: $0.17
Target 2: $0.20
Target 3: $0.26
Potential target : $ 0.36
SL: $ 0.11
A clean break above current resistance $0.15 could open the door for a 100%+ upside move from current levels. Keep an eye on volume and confirmation signals.
This setup is worth watching—low risk, high reward if momentum builds.

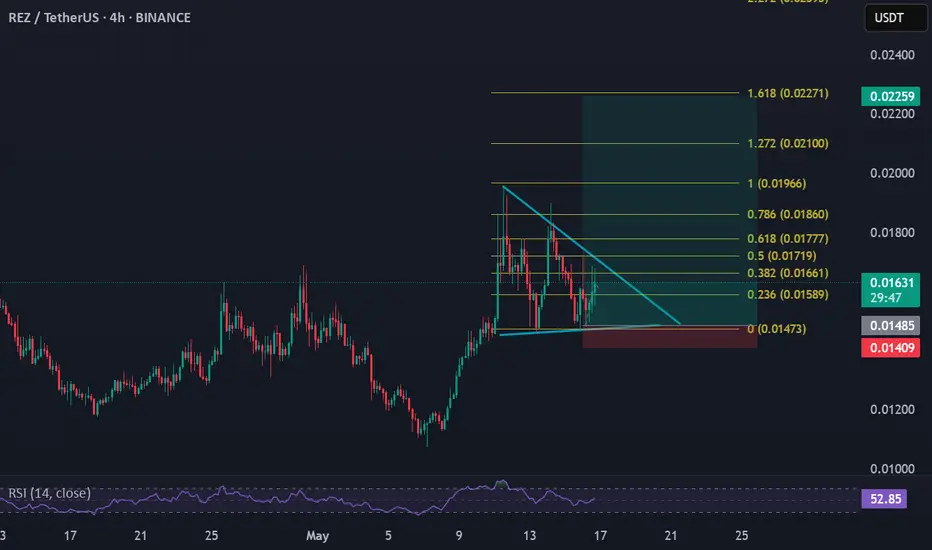
$REZ Reversal in Motion – Eyes on the Next Wave UpAMEX:REZ reversed major resistance into support upon coming out of a downtrend.
We are currently looking for a pullback towards the 0.618 Fib level at 0.015 before the next wave up.
The market structure is still bullish, and the chart is priming for an explosive breakout into $0.023+.
Keep alert and observe that level.👀
DYOR, NFA

Waiting to explode $REZUSDTContinuation triangle for breakout BINANCE:REZUSDT ,
SL & Tp look at the chart
REZ 3D Setup – Classic Reversal Pattern in Play🔥 REZ – 3D Setup on Watch
📉 REZ is shaping up a falling wedge on the 3-day chart—a well-known bullish reversal pattern 🔍
A breakout from this structure could trigger strong upside momentum 🚀
👀 Keep this on your radar—the higher timeframe setup is starting to heat up!

REZUSDT 2D#REZ has broken out of the falling wedge pattern to the upside on the 2-day chart and is now facing the 2-day MA50. In case of a successful bounce of the pattern and breakout above the 2-day MA50, the targets are:
🎯 $0.01928
🎯 $0.02362
🎯 $0.03109
🎯 $0.03713
🎯 $0.04316
⚠️ Use a tight stop-loss.

#REZ/USDT#REZ
The price is moving within a descending channel on the 1-hour frame, adhering well to it, and is on its way to breaking it strongly upwards and retesting it.
We are seeing a rebound from the lower boundary of the descending channel, this support at 0.01570.
We have a downtrend on the RSI indicator that is about to break and retest, supporting the upward trend.
We are looking for stability above the 100 moving average.
Entry price: 0.01760
First target: 0.01850
Second target: 0.01965
Third target: 0.02125

$REZ breakout alert!! AMEX:REZ breaking out of a strong downtrend!
After months of consolidation and lower highs, AMEX:REZ just flipped a major descending trendline resistance into support 💥
Now trading above it with strong momentum (+9.6%) and eyes set on the key targets:
📍 First Target: $0.0218
📍 Second Target: $0.0293
📍 Final Target Zone: $0.0405–$0.0407
This move confirms a shift in trend, and opportunities like these don’t come often.
Watch the retest zone closely and manage risk accordingly.
Let the breakout begin!
If you find this analysis helpful, please hit the like button to support my content! Share your thoughts in the comments, and feel free to request any specific chart analysis you’d like to see.
Happy Trading!!

REZUSDT 1D AnalysisREZ ~ 1D Analysis
#REZ Buy after successfully penetrating this resistant line with a short -term target of at least 10%+ from here.


REZUSDTTP 02083
Buy zone 0.01786 - 0.01822
SL 0.01755
it's bounce back from the strong support
Nice Project good for Long term always buy with STOP LOSS
Only Trade in SPOT.


REZ Analysis (8H)After the iCH formed on the chart, it seems we are in parts of wave C, which, after absorbing liquidity from lower areas, could push the price upward and complete the bullish segments of wave C.
We are looking for buy/long positions around the green zone; however, reaching this area might take some time, so this asset should be kept on the watchlist.
A daily candle closing below the invalidation level will invalidate this analysis.
For risk management, please don't forget stop loss and capital management
Comment if you have any questions
Thank You

REZUSDT – Critical Resistance Zones Identified!REZUSDT is approaching major resistance levels marked by the red boxes. These are not random points—they are carefully selected using Volume Footprint and Time Price Opportunities, advanced methods that most traders don’t even know exist.
🔥 Key Market Dynamics:
✅ Red Boxes = Strong Resistance
For the price to continue higher, these levels must be broken with volume and retested as support. Until that happens, this is not a bullish setup.
✅ Smart Trading Approach
Blindly longing into resistance is reckless. The smart move here is to look for short setups with confirmation from lower time frame (LTF) breakdowns and CDV divergences at these resistance points.
✅ Risk Management is Key
If resistance holds, short positions from these levels provide great risk-reward opportunities. If we break above, we wait for a confirmed retest before considering longs.
📌 Why My Analysis Matters
This is not just basic support/resistance trading—it’s a highly professional strategy that gives a real edge. Most traders don’t know how to read order flow, volume footprint, or CDV data. That’s why they struggle.
You can track my high success rate on my profile, and if you want to trade at the highest level, this is where you need to be. Stay ahead of the market, follow the plan, and execute like a pro.
📌I keep my charts clean and simple because I believe clarity leads to better decisions.
📌My approach is built on years of experience and a solid track record. I don’t claim to know it all but I’m confident in my ability to spot high-probability setups.
📌If you would like to learn how to use the heatmap, cumulative volume delta and volume footprint techniques that I use below to determine very accurate demand regions, you can send me a private message. I help anyone who wants it completely free of charge.
🔑I have a long list of my proven technique below:
🎯 ZENUSDT.P: Patience & Profitability | %230 Reaction from the Sniper Entry
🐶 DOGEUSDT.P: Next Move
🎨 RENDERUSDT.P: Opportunity of the Month
💎 ETHUSDT.P: Where to Retrace
🟢 BNBUSDT.P: Potential Surge
📊 BTC Dominance: Reaction Zone
🌊 WAVESUSDT.P: Demand Zone Potential
🟣 UNIUSDT.P: Long-Term Trade
🔵 XRPUSDT.P: Entry Zones
🔗 LINKUSDT.P: Follow The River
📈 BTCUSDT.P: Two Key Demand Zones
🟩 POLUSDT: Bullish Momentum
🌟 PENDLEUSDT.P: Where Opportunity Meets Precision
🔥 BTCUSDT.P: Liquidation of Highly Leveraged Longs
🌊 SOLUSDT.P: SOL's Dip - Your Opportunity
🐸 1000PEPEUSDT.P: Prime Bounce Zone Unlocked
🚀 ETHUSDT.P: Set to Explode - Don't Miss This Game Changer
🤖 IQUSDT: Smart Plan
⚡️ PONDUSDT: A Trade Not Taken Is Better Than a Losing One
💼 STMXUSDT: 2 Buying Areas
🐢 TURBOUSDT: Buy Zones and Buyer Presence
🌍 ICPUSDT.P: Massive Upside Potential | Check the Trade Update For Seeing Results
🟠 IDEXUSDT: Spot Buy Area | %26 Profit if You Trade with MSB
📌 USUALUSDT: Buyers Are Active + %70 Profit in Total
🌟 FORTHUSDT: Sniper Entry +%26 Reaction
🐳 QKCUSDT: Sniper Entry +%57 Reaction
📊 BTC.D: Retest of Key Area Highly Likely
📊 XNOUSDT %80 Reaction with a Simple Blue Box!
📊 BELUSDT Amazing %120 Reaction!
I stopped adding to the list because it's kinda tiring to add 5-10 charts in every move but you can check my profile and see that it goes on..

REZUSDT CHART ANALYSİS - EDUCATIONAL POSTDiscover what an NFT is and what all the hype is that's surrounding the space.
An NFT, or non-fungible token, is a unique, digital certificate stored on a blockchain. This guarantees the originality of any item, giving the owner exclusive rights to it. Such tokens cannot be discreetly tampered with, split, or replaced because of the nature of the blockchain structure and anonymous encryption technology.
Therefore, this system is best suited for securing rights to a unique object — a work of art, real estate, an artifact in a computer game, or something similar. This article will help you understand the peculiarities of the NFT concept and learn about the most expensive and unusual non-fungible tokens since their creation.

REZUSDT // head and shoulders formationAlthough there is a reverse head and shoulders formation on the chart, the targets are drawn according to Fibonacci.Let's look for closures above the blue line.

REZUSDTWe can attempt to buy REZUSDT from specified level as it make HL , also there is no bearish divergence occur indicate that it moves upward.
SL , TP mention in chart.

REZ Sell/Short Setup (4H)We don’t have a bearish iCH on the chart yet for the substructure to turn bearish, but the price has reached a strong supply zone. Additionally, the lows of recent candles have all been lower than the previous ones, suggesting a potential move to the downside.
Targets are marked on the chart.
A 4-hour candle closing above the invalidation level will invalidate this analysis.
Do not enter the position without capital management and stop setting
Comment if you have any questions
thank you
