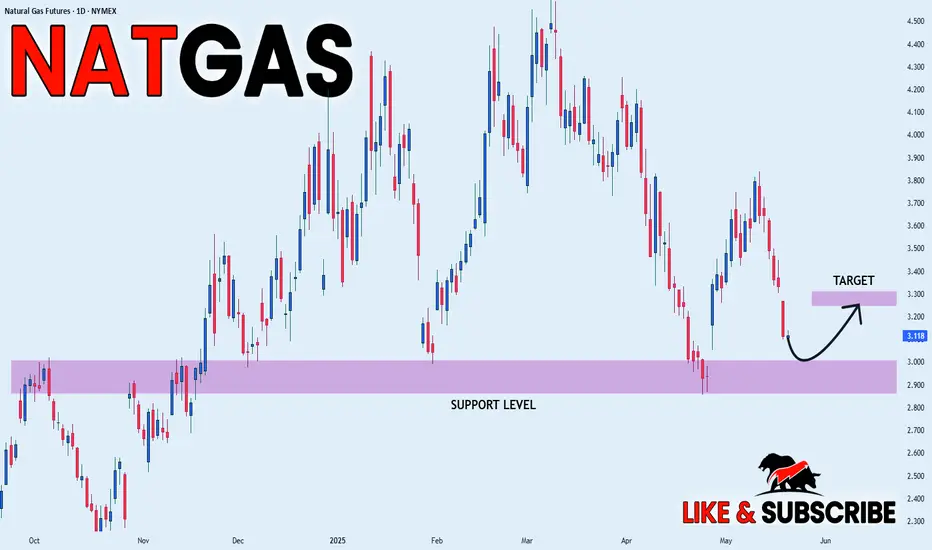
NATGAS: Long Trade Explained
NATGAS
- Classic bullish pattern
- Our team expects retracement
SUGGESTED TRADE:
Swing Trade
Buy NATGAS
Entry - 3.325
Stop - 3.206
Take - 3.559
Our Risk - 1%
Start protection of your profits from lower levels
Disclosure: I am part of Trade Nation's Influencer program and receive a month

NATURALGAS - BEARISH Trend/ D cup formation confirmed?NATURALGAS – Weekly Update
Timeframe: 1HR | Symbol: NATURALGAS1! (MCX)
Pattern : D Cup Formation Completed
Natural Gas has formed a textbook "D Cup" pattern, indicating a rounded top reversal structure. After a parabolic rise in late April, prices have gradually given up gains, confirming the pat

NATGAS LOCAL SHORT|
✅NATGAS has retested a key resistance level of 3.50$
And as the pair is already making a bearish pullback
A move down to retest the demand level below at 3.30$ is likely
SHORT🔥
✅Like and subscribe to never miss a new idea!✅
Disclosure: I am part of Trade Nation's Influencer program and r

NATGAS SWING LONG|
✅NATGAS is set to retest a
Strong support level below at 2.90$
After trading in a local downtrend from some time
Which makes a bullish rebound a likely scenario
With the target being a local resistance above at 3.26$
LONG🚀
✅Like and subscribe to
Naturalgas short term Selling Opportunity NaturalGas May Future!
Naturalgas shorting will see Level of Rs 260-250 from CMP Rs302. With SL of Rs320 in upcoming weeks. Sellers will dominate from Rs310 level. If Price sustain below cmp will see downside rally till Rs260-Rs250.

Natural Gas | Oil | Dollar | Silver | Gold Price ForecastNatural Gas | Oil | Dollar | Silver | Gold Price Forecast
NYMEX:NG1! CAPITALCOM:NATURALGAS COMEX:GC1! COMEX:SI1!

NATGAS Will Collapse! SELL!
My dear friends,
My technical analysis for NATGAS is below:
The market is trading on 3.787 pivot level.
Bias - Bearish
Technical Indicators: Both Super Trend & Pivot HL indicate a highly probable Bearish continuation.
Target - 3.487
Recommended Stop Loss - 3.956
About Used Indicators:
A pivo

Natural Gas Price Rejected at Resistance – Bears in Control
The current price ($3.692) is trading below the 20-day simple moving average (middle Bollinger Band), indicating short-term weakness. This often suggests bearish momentum when combined with a failure to close above the mid-band.
In early May, price touched or neared the upper Bollinger Band and w

Gas is about to move upThis channel is not providing individualized trading or investment advice, nor is it a banking service, brokerage service, trading service, investment service or money management service

NG 5/22/25 - Re-engaging the Short side!Here is an update on NG (Natural Gas Futures) via analyzing Cumulative Delta Volume (CDV), divergence between price and the Money Flow Index (MFI), and the 4h and D McGinley Moving Averages!
Happy trading, and I hope the video was helpful!

See all ideas
A representation of what an asset is worth today and what the market thinks it will be worth in the future.
Displays a symbol's price movements over previous years to identify recurring trends.