Nvidia - This is clearly not the end!📐Nvidia ( NASDAQ:NVDA ) will simply rally more:
🔎Analysis summary:
Yes, over the past couple of months, Nvidia has been rallying another +100%. But looking at the higher timeframe, this is still not the end of the unbelievable bullrun. Following the rising channel pattern, Nvidia can rally an
Next report date
—
Report period
—
EPS estimate
—
Revenue estimate
—
104.75 THB
2.46 T THB
4.41 T THB
23.41 B
About NVIDIA
Sector
Industry
CEO
Jen Hsun Huang
Website
Headquarters
Santa Clara
Founded
1993
ISIN
TH0150121000
FIGI
BBG01H3S2D69
NVIDIA Corp. engages in the design and manufacture of computer graphics processors, chipsets, and related multimedia software. It operates through the following segments: Graphics Processing Unit (GPU) and Compute & Networking. The Graphics segment includes GeForce GPUs for gaming and PCs, the GeForce NOW game streaming service and related infrastructure, Quadro and NVIDIA RTX GPUs for enterprise workstation graphics, virtual GPU, or vGPU, software for cloud-based visual and virtual computing, automotive platforms for infotainment systems, and Omniverse Enterprise software for building and operating metaverse and 3D internet applications. The Compute & Networking segment consists of Data Center accelerated computing platforms and end-to-end networking platforms including Quantum for InfiniBand and Spectrum for Ethernet, NVIDIA DRIVE automated-driving platform and automotive development agreements, Jetson robotics and other embedded platforms, NVIDIA AI Enterprise and other software, and DGX Cloud software and services. The company was founded by Jen Hsun Huang, Chris A. Malachowsky, and Curtis R. Priem in April 1993 and is headquartered in Santa Clara, CA.
Related stocks

Nvidia - This is clearly not the end!📐Nvidia ( NASDAQ:NVDA ) will confirm the breakout:
🔎Analysis summary:
Over the past couple of months, Nvidia managed to rally about +100%, reaching top 1 of total market cap. Most of the time such bullish momentum just continues and new all time highs will follow. But in order for that to hap

$NVDA: Cycle-Wired Levels🏛️ Research Notes
The fact that the angle of linear connection between 3rd degree points (fractal hierarchy) acted multiple amout of times as support and eventually resistance from which tariff drop happened establishing bottom and expanding from there.
That means if we were to justify the

Emotional Reactivity: The Silent Killer of Trading PerformanceEven with the best strategy, traders often fall short — not because the system fails, but because they do. One of the most common culprits? Emotional reactivity.
Fear and greed are the twin saboteurs.
Fear leads to hesitation, premature exits, or failure to take action.
Greed tempts us to oversiz

NVDA: Bullish Channels and Momentum CheckWe're seeing a compelling case for continued upward momentum in NVDA, but it's crucial to understand the different layers of the trend and key resistance levels.
Macro Trend: The Expanding Bullish Channel
On the weekly timeframe, a larger expanding bullish channel has been forming. The price is c

NVDA Weekly Trade Setup (2025-08-02)
### 🟢 NVDA Weekly Trade Setup (2025-08-02)
🚀 **BULLISH CONSENSUS** across 5 top-tier models
📉 Daily RSI: Weak — but weekly trend is STRONG
💼 Institutional Volume: Confirmed accumulation
📊 Options Flow: Call/Put leaning bullish
---
### 🎯 TRADE SETUP
**💥 Direction:** CALL (LONG)
**📍 Strike:** \$1

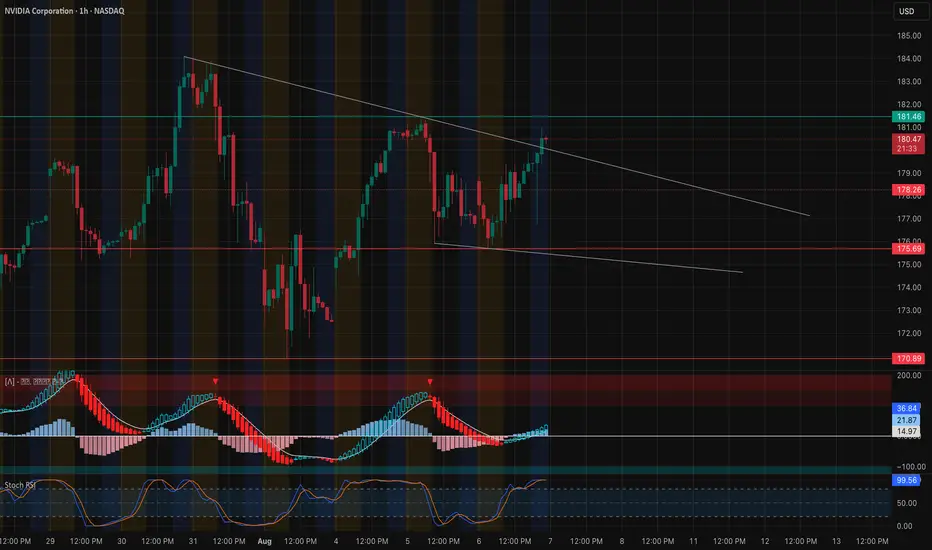
NVIDIA at the Crossroads: Will This Breakout Hold or Fake? Aug 7🧠 Technical Analysis – 1H + 15M Chart
NVDA is testing the upper bound of a symmetrical triangle on the 1-hour chart — a critical spot that could either break for continuation or reject back into the wedge.
* Trendline resistance from previous highs is pressing NVDA around 180.80–181.50.
* Stochastic
NVIDIANVIDIA Corporation is a leading American technology company known for designing and manufacturing graphics processing units (GPUs), system-on-a-chip units (SoCs), and AI computing platforms. Founded in 1993, the company originally focused on gaming graphics but has since evolved into a global powerh

NVDA: Last week of July Just my thoughts on NVDA.
Not advice of course.
As always, trade safe and have a great weekend!

NVDA Don't Miss Out !!!!
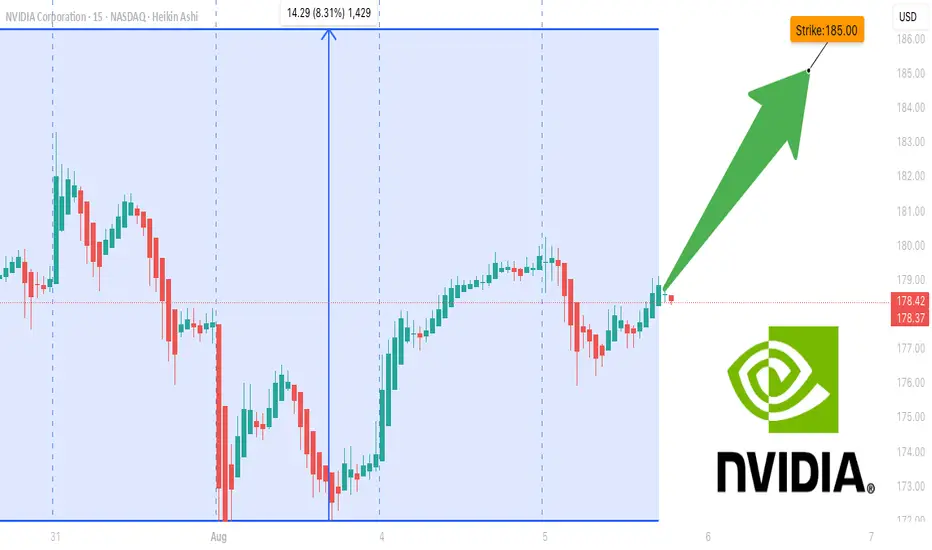
**NVDA \$185C Weekly Momentum Surge ⚡ All Models Aligned – 75% Confidence Setup 🔥**
---
### 📊 **Post Body (Optimized for TradingView):**
**NVDA Weekly Call Play — Aug 8 Expiry (3 DTE) 🔥**
📈 **Momentum Snapshot:**
* **Weekly RSI:** 🔼 Above 50 and climbing
* **Daily RSI:** 🔻 Falling — short-term
See all ideas
Summarizing what the indicators are suggesting.
Oscillators
Neutral
SellBuy
Strong sellStrong buy
Strong sellSellNeutralBuyStrong buy
Oscillators
Neutral
SellBuy
Strong sellStrong buy
Strong sellSellNeutralBuyStrong buy
Summary
Neutral
SellBuy
Strong sellStrong buy
Strong sellSellNeutralBuyStrong buy
Summary
Neutral
SellBuy
Strong sellStrong buy
Strong sellSellNeutralBuyStrong buy
Summary
Neutral
SellBuy
Strong sellStrong buy
Strong sellSellNeutralBuyStrong buy
Moving Averages
Neutral
SellBuy
Strong sellStrong buy
Strong sellSellNeutralBuyStrong buy
Moving Averages
Neutral
SellBuy
Strong sellStrong buy
Strong sellSellNeutralBuyStrong buy
Displays a symbol's price movements over previous years to identify recurring trends.
NVDA4971918
NVIDIA Corporation 3.5% 01-APR-2050Yield to maturity
5.94%
Maturity date
Apr 1, 2050
NVDA4971919
NVIDIA Corporation 3.7% 01-APR-2060Yield to maturity
5.92%
Maturity date
Apr 1, 2060
NVDA4971917
NVIDIA Corporation 3.5% 01-APR-2040Yield to maturity
5.32%
Maturity date
Apr 1, 2040
US67066GAN4
NVIDIA 21/31Yield to maturity
4.40%
Maturity date
Jun 15, 2031
US67066GAE4
NVIDIA 2026Yield to maturity
4.21%
Maturity date
Sep 16, 2026
NVDA4971916
NVIDIA Corporation 2.85% 01-APR-2030Yield to maturity
4.07%
Maturity date
Apr 1, 2030
NVDA5203204
NVIDIA Corporation 1.55% 15-JUN-2028Yield to maturity
3.96%
Maturity date
Jun 15, 2028
See all NVDA80 bonds
Curated watchlists where NVDA80 is featured.


