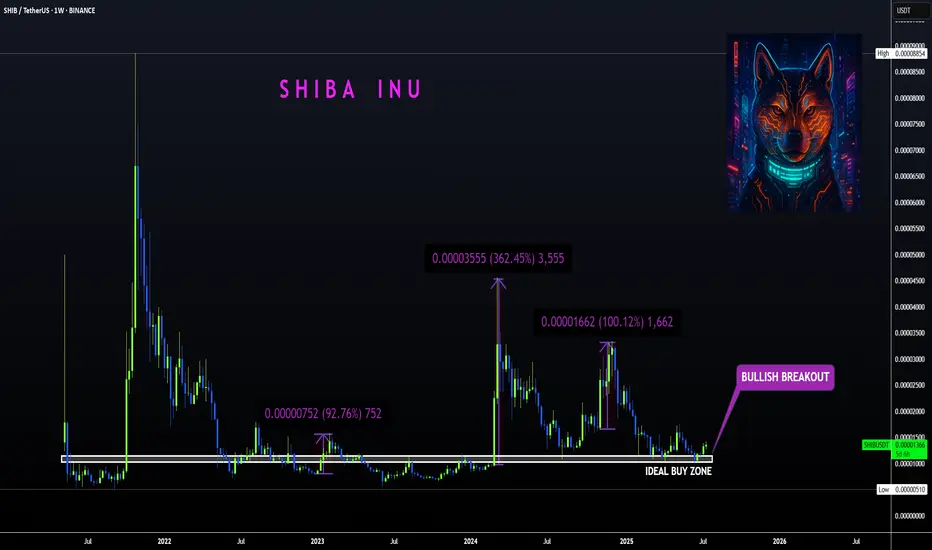
SHIBA | Bullish Breakout ABOVE Ideal Buy ZoneBINANCE:SHIBUSDT
Shiba is know to make big increases in short periods of time... that's why we love it!
The tricky thing about SHIBA is that the pumps can be unpredictable so the best way to ensure a position is to buy as low as possible to the ideal buy zone.
In the weekly timeframe, the tec
Related pairs
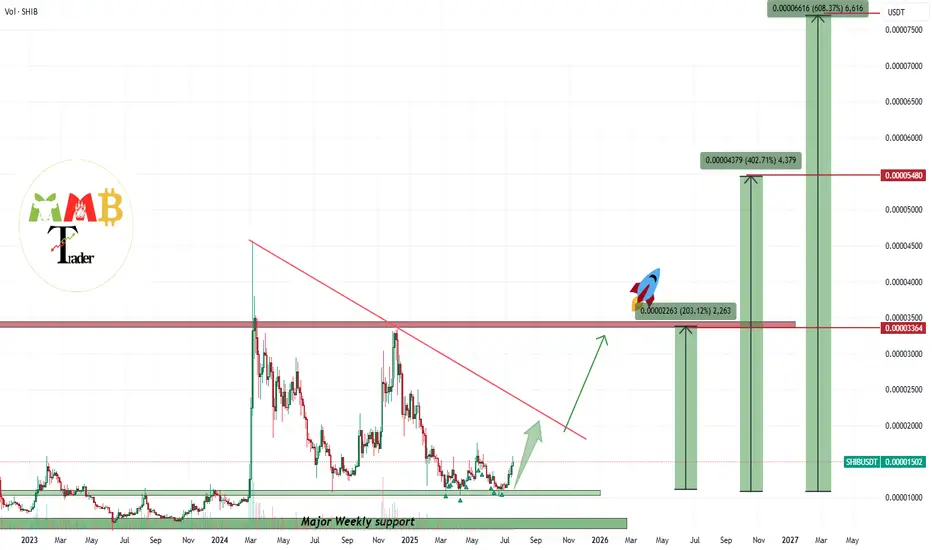
SHIBUSDT Best 3 points to save 600% gainHi as we can see on this chart Price is just starting to pump and hit our 600% Target and even then it is still far from Previous ATH.
Market is getting bullish once again and we are looking for rise and gain here too and our targets are all mentioned on the chart and major pump will start after bre

Shiba Inu Still Early Massive Wave yet Bullish —1,558% PPThe blue pattern on the chart is an analog of the purple pattern but bigger.
It is still early for Shiba Inu (SHIBUSDT) because the action is happening below MA200. The long-term bullish bias is only confirmed once the action moves and closes above this level.
This shouldn't be considered bearish

bullish simetrical pattern weekly corrective simetrical triangle done... now it should go up so fast .

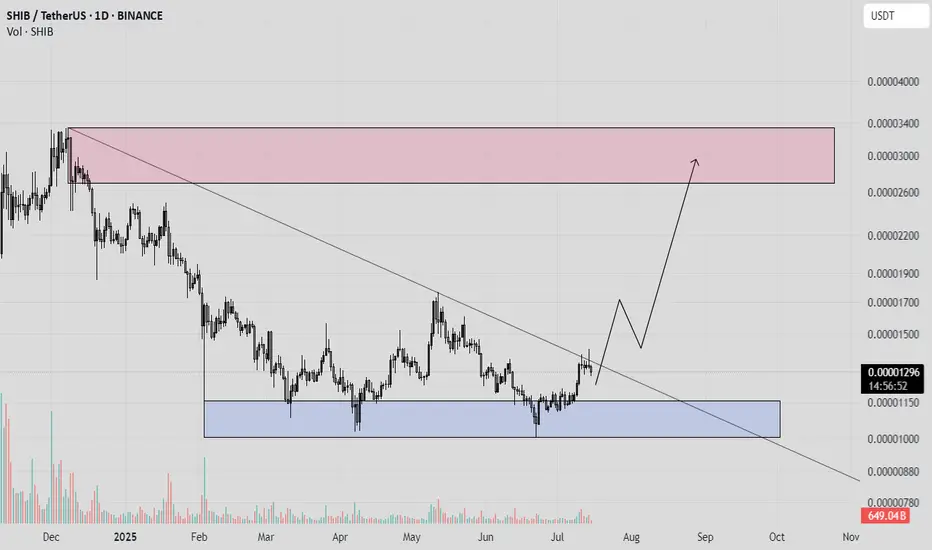
SHIB: Keep an eye on this level! Trading Setup
If you’re considering trading SHIB, here’s a quick setup that may help you.
The idea is: Buy when the price breaks above $0.000014 and take profits at the levels shown in the chart.
Targets:
1. $0.0000153
2. $0.0000183
3. $0.000021
4. $0.0000235
--------------------------------

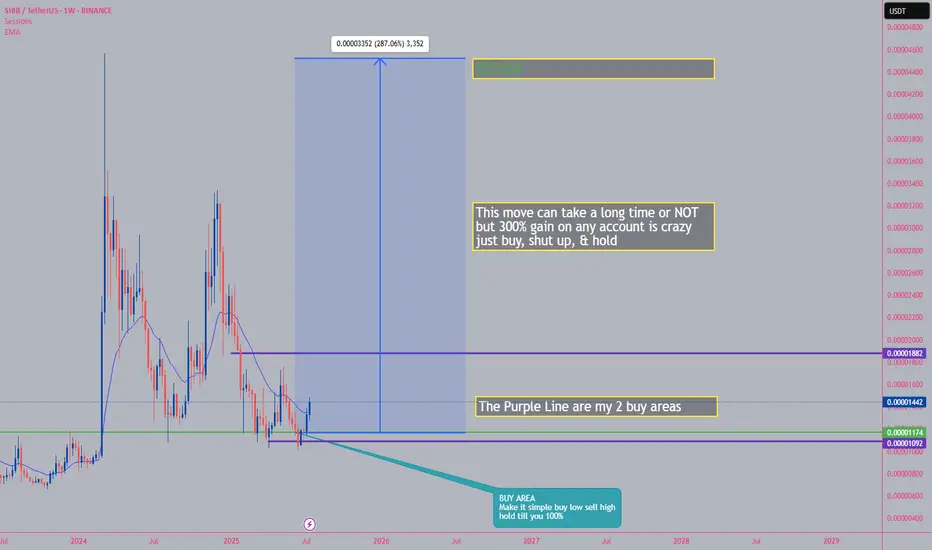
SHIBUSDT first target is +200% after years of sleepBINANCE:SHIBUSDT is not dead or sleep or it wont be any more and i think in this market soon it can see more gain and this +40% until now is just start and at least our first target which is +200% can hit soon like green arrow.
DISCLAIMER: ((trade based on your own decision))
<<press like👍 if you
Can Shiba Inu rally 20 percent to hit 0.000015?Hello✌
All previous targets were nailed ✅! Now, let’s dive into a full analysis of the upcoming price potential for Shiba Inu📈.
BINANCE:SHIBUSDT has decisively broken above its descending channel and key daily resistance, supported by fresh, solid volume 📈. This breakout signals strong momentum

SHIB NEXT TARGET#SHIB
Shiba Inu is forming a descending channel pattern on the daily timeframe🔍
The price is consolidating above the midline support and is currently testing the MA 50💁♂️
Breaking above this MA could drive the price toward targets at $0.00001500, $0.00001750, $0.00002050, and $0.00002500🎯

SHIBSHIBA INU
Shiba Inu is a meme token inspired by Dogecoin but aimed to take the concept further by emphasizing community involvement.
Everything is clear on the chart.
I wish everyone abundant profits.
Like and follow
for more.
DON'T FORGET SHIB IT WILL FLY SOONI've been in this trade for about 5 Months, but patients always pay off no matter if it's 1-2 years it will pay off in the long run thanks you GehavianGoals for holding I'm just thanking myself in this message
See all ideas
Summarizing what the indicators are suggesting.
Oscillators
Neutral
SellBuy
Strong sellStrong buy
Strong sellSellNeutralBuyStrong buy
Oscillators
Neutral
SellBuy
Strong sellStrong buy
Strong sellSellNeutralBuyStrong buy
Summary
Neutral
SellBuy
Strong sellStrong buy
Strong sellSellNeutralBuyStrong buy
Summary
Neutral
SellBuy
Strong sellStrong buy
Strong sellSellNeutralBuyStrong buy
Summary
Neutral
SellBuy
Strong sellStrong buy
Strong sellSellNeutralBuyStrong buy
Moving Averages
Neutral
SellBuy
Strong sellStrong buy
Strong sellSellNeutralBuyStrong buy
Moving Averages
Neutral
SellBuy
Strong sellStrong buy
Strong sellSellNeutralBuyStrong buy
Displays a symbol's price movements over previous years to identify recurring trends.
Frequently Asked Questions
The current price of SHIB / UST (SHIB) is 0.00001473 USDT — it has risen 3.02% in the past 24 hours. Try placing this info into the context by checking out what coins are also gaining and losing at the moment and seeing SHIB price chart.
SHIB / UST price has risen by 14.14% over the last week, its month performance shows a 28.73% increase, and as for the last year, SHIB / UST has decreased by −20.68%. See more dynamics on SHIB price chart.
Keep track of coins' changes with our Crypto Coins Heatmap.
Keep track of coins' changes with our Crypto Coins Heatmap.
SHIB / UST (SHIB) reached its highest price on Oct 28, 2021 — it amounted to 0.00008246 USDT. Find more insights on the SHIB price chart.
See the list of crypto gainers and choose what best fits your strategy.
See the list of crypto gainers and choose what best fits your strategy.
SHIB / UST (SHIB) reached the lowest price of 0.00000546 USDT on Jun 10, 2023. View more SHIB / UST dynamics on the price chart.
See the list of crypto losers to find unexpected opportunities.
See the list of crypto losers to find unexpected opportunities.
The safest choice when buying SHIB is to go to a well-known crypto exchange. Some of the popular names are Binance, Coinbase, Kraken. But you'll have to find a reliable broker and create an account first. You can trade SHIB right from TradingView charts — just choose a broker and connect to your account.
Crypto markets are famous for their volatility, so one should study all the available stats before adding crypto assets to their portfolio. Very often it's technical analysis that comes in handy. We prepared technical ratings for SHIB / UST (SHIB): today its technical analysis shows the buy signal, and according to the 1 week rating SHIB shows the buy signal. And you'd better dig deeper and study 1 month rating too — it's sell. Find inspiration in SHIB / UST trading ideas and keep track of what's moving crypto markets with our crypto news feed.
SHIB / UST (SHIB) is just as reliable as any other crypto asset — this corner of the world market is highly volatile. Today, for instance, SHIB / UST is estimated as 10.14% volatile. The only thing it means is that you must prepare and examine all available information before making a decision. And if you're not sure about SHIB / UST, you can find more inspiration in our curated watchlists.
You can discuss SHIB / UST (SHIB) with other users in our public chats, Minds or in the comments to Ideas.