SHIB/USDT: Shiba Inu Setting Up for a Bullish Reversal?Shiba Inu (SHIB) is currently trading around $0.00001208, showing signs of stabilizing near a key support zone after a recent pullback. The market appears to be forming a rounded double bottom pattern, which could evolve into a strong W-shaped bullish reversal if confirmed with volume and breakout above short-term resistance (~$0.0000135).
This level could be pivotal for long-term accumulation.
What to Watch
*Key Support Zone: $0.00001200 - price is holding this level firmly.
*Short-Term Resistance: $0.0000135 - a breakout could confirm bullish continuation.
*Indicators: RSI is cooling off after a high, which could provide momentum for a new leg up.
SHIB may be quietly setting the stage for a powerful recovery. This support level looks like a gift for those with patience and vision. DCA smartly, monitor dips, and don’t panic, because when this pattern breaks out, you’ll wish you had loaded up earlier.
This isn't about hype...it’s about positioning. Stay disciplined. Stick to your plan. SHIB might just surprise everyone again.
SHIBUST trade ideas
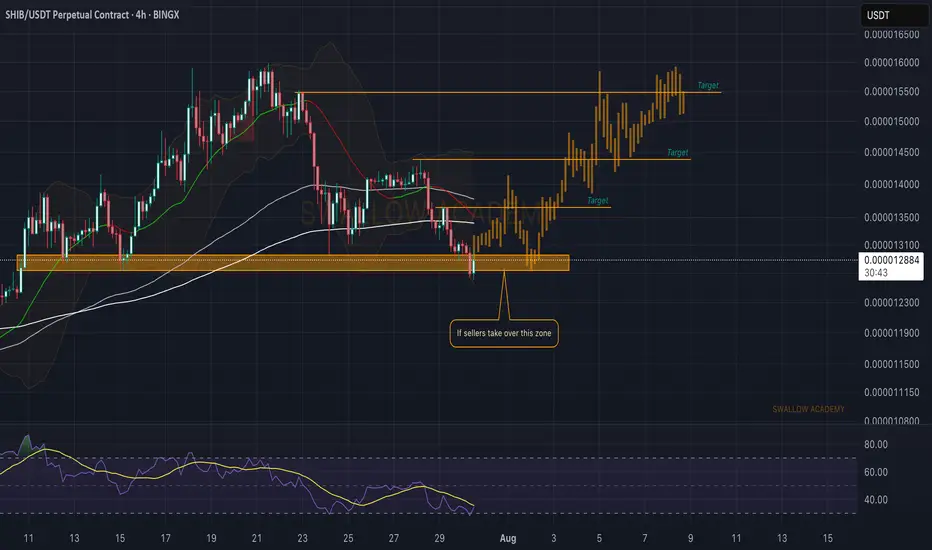
Shiba Inu (SHIB): Might Bounce From Here | Looking For PumpShiba is showing some signs of recovery, where we are seeing the buyers taking back the control near the local support zone, which would then lead to a 10% movement to upper zones (if not more).
So we look for more clarity and dominance from buyers here and once we see it, we are going to go long.
Swallow Academy
DeGRAM | SHIBUSD fell below the support line📊 Technical Analysis
● A classic Head and Shoulders pattern has formed below resistance at 0.00001411, confirming a bearish reversal with neckline break.
● Price is descending inside a bearish flag and is testing prior support at 0.00001270, with the next major level near 0.00001088.
💡 Fundamental Analysis
● Risk sentiment weakened after latest FOMC minutes signaled persistent inflation risk, fueling a defensive tilt in crypto.
● Whale outflows from SHIB wallets and declining DEX volumes suggest bearish positioning and fading demand.
✨ Summary
Bearish reversal confirmed below 0.00001411. Break of 0.00001270 opens path to 0.00001088. Watch neckline retests for renewed selling pressure.
-------------------
Share your opinion in the comments and support the idea with a like. Thanks for your support!

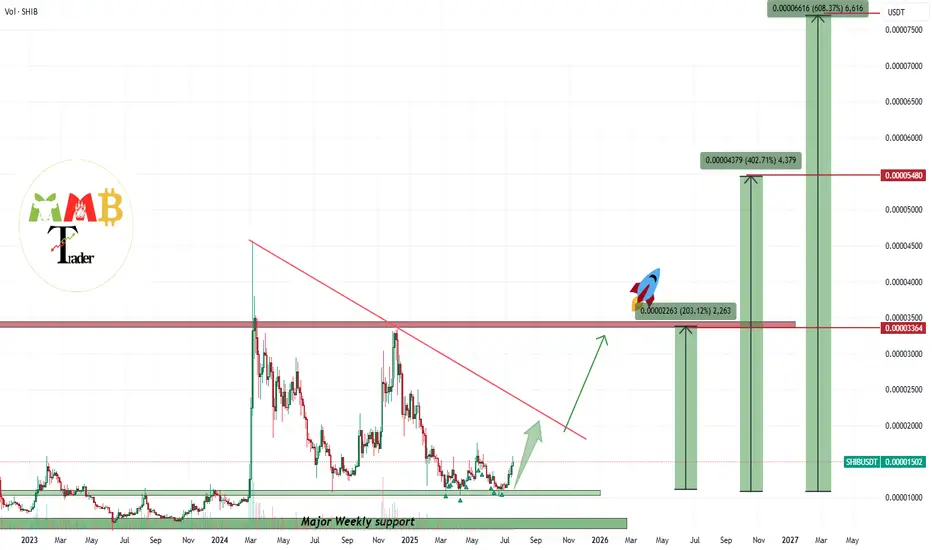
SHIBUSDT major weekly support of 0.000010$ is strong!!Two weekly supports which are 0.000010$ & 0.000007$ are strong enough to hold price like past years and i think soon those weekly +100% candles will surprise us here on BINANCE:SHIBUSDT too.
all major supports and resistances are all also mentioned on the chart too.
DISCLAIMER: ((trade based on your own decision))
<<press like👍 if you enjoy💚

Here’s Why Shiba Inu Price’s 10% Rise Entails $50 Million LossesAt the time of writing, BINANCE:SHIBUSDT price is $0.00001407, sitting just below the resistance level of $0.00001435. The altcoin has been facing mixed signals, with both bearish and bullish factors playing a role in its price action. The key resistance level of $0.00001435 needs to be broken for a potential recovery.
The liquidation map shows a fascinating development: if BINANCE:SHIBUSDT recovers the 10% losses it has sustained by reaching $0.00001553, it could trigger over $52 million worth of short liquidations . Short sellers have been betting on a decline, but if SHIB rebounds, these traders will face considerable losses.
If BINANCE:SHIBUSDT continues to hover within the consolidation range of $0.00001435 and $0.00001317 , traders will remain safe from liquidation risks. This sideways movement will keep the altcoin within a neutral zone, avoiding drastic price changes in the immediate term.
However, if BINANCE:SHIBUSDT price manages to break the resistance at $0.00001435 and flips it into support, SHIB could potentially climb back to $0.00001553. This would mark a 10% recovery , invalidating the current bearish sentiment and shifting the outlook to a more optimistic tone.

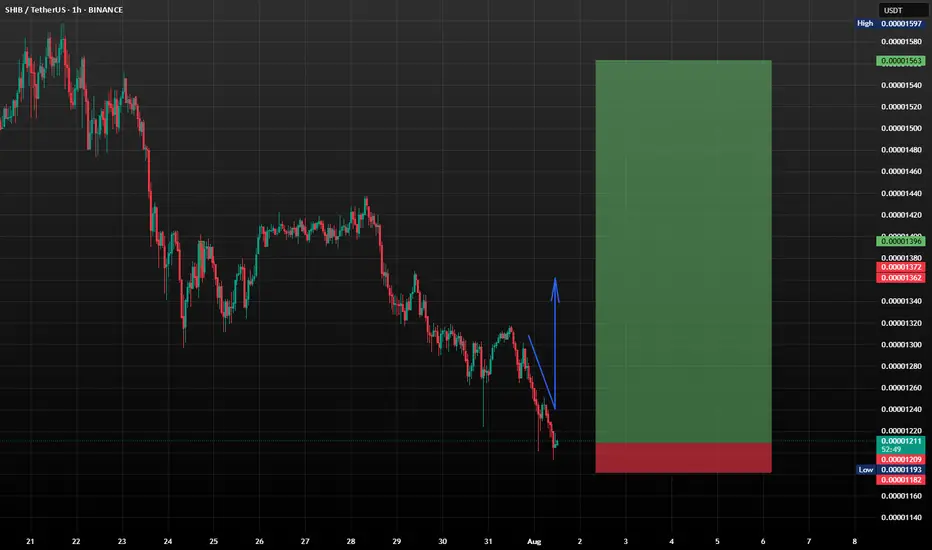
SHIB Bullish DivergenceBINANCE:SHIBUSDT
Trade Setup:
Target 1: 0.00001335 (0.786 Fibonnaci Golden Zone).
Target 2: 0.00001391 (0.618 Fibonnaci Golden Zone).
Target 3: 0.00001430 (0.5 Fibonnaci Golden Zone).
Target 4: 0.00001597 (0 Fibonnaci).
Stop Loss: 0.00001172 (1.272 Fibonnaci).
RSI Analysis: The RSI is showing a bullish divergence, suggesting potential bullish momentum. The current RSI is around 24.02, approaching oversold territory, so caution is advised.

Shiba Inu (SHIB): Waiting For Buyers To Break 200 Moving AverageShiba had recently been rejected by 200EMA, and since getting rejected, the price has been falling and sellers are starting to show dominance, but this does not mean that we are entering yet into a bearish trend.
As we got a rejection, now we are waiting and going to monitor how the next candles will develop the structure, and based on it, we will be trading, but looking at the overall picture, we are looking for that 200EMA to be broken, after which we might be getting a good upward movement from there.
Swallow Academy

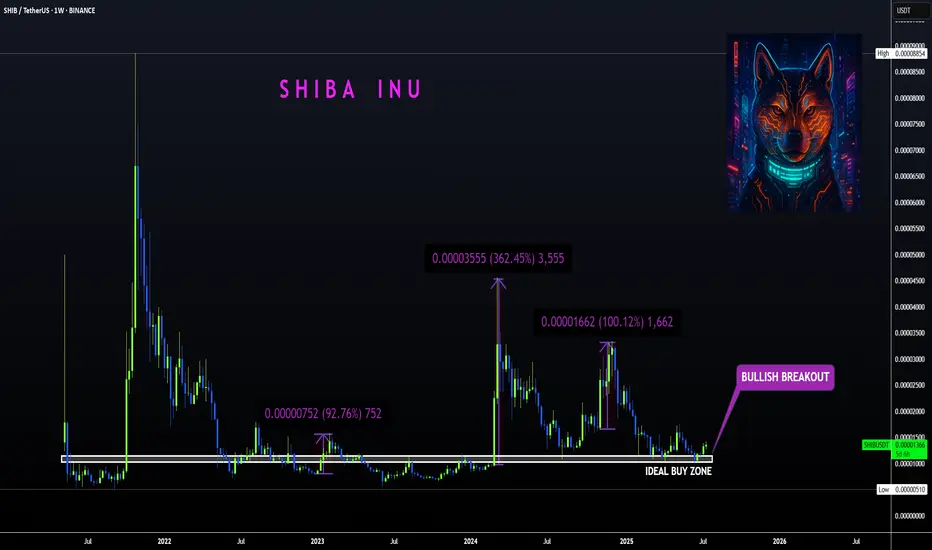
SHIBA | Bullish Breakout ABOVE Ideal Buy ZoneBINANCE:SHIBUSDT
Shiba is know to make big increases in short periods of time... that's why we love it!
The tricky thing about SHIBA is that the pumps can be unpredictable so the best way to ensure a position is to buy as low as possible to the ideal buy zone.
In the weekly timeframe, the technical indicators are not quite bullish yet. The moving averages is still above the price, meaning the bulls have yet to take full control of the price in lower timeframes.
The same can be said for the daily, although we are seeing progress as the 200d moving averages have been reclaimed:
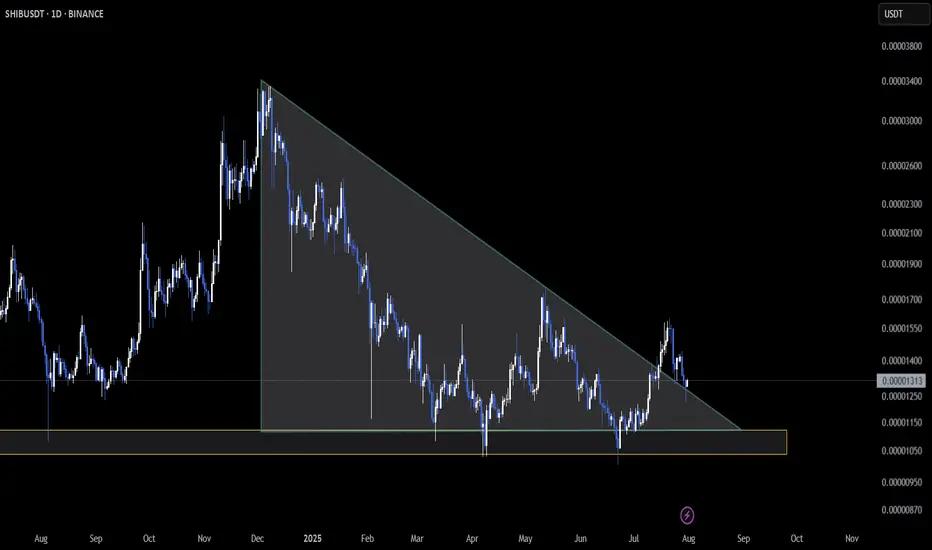
SHIB Retests Triangle Support as Pressure Mounts🔥 CRYPTOCAP:SHIB is locked into a key zone on the daily chart — price is retesting the base of a descending triangle structure 🛡️
So far, support is holding, but the range is tightening. A strong bounce here could kick off a recovery move 📈
⚠️ On the flip side, a breakdown would confirm bearish continuation and shift momentum to the downside.
👀 This is a must-watch level — clean structure, high stakes.
Do you see SHIB bouncing from here or breaking below?
Not financial advice.
SHIBUSDT OLD enough to break the resistance and pump soon While the spots are waking up it seems here we have kind of sleep and dead coin named BINANCE:SHIBUSDT but this turtle🐢 usually pump later than any one else in market and kill the emotions of some holders.
So be patient + wait for breakout of red trendline = Heavy pump and profit coming.
DISCLAIMER: ((trade based on your own decision))
<<press like👍 if you enjoy💚

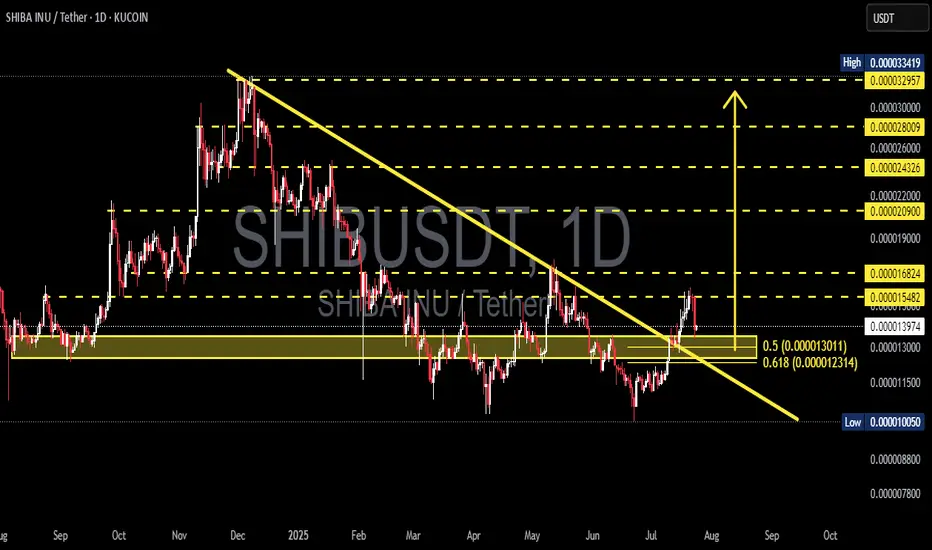
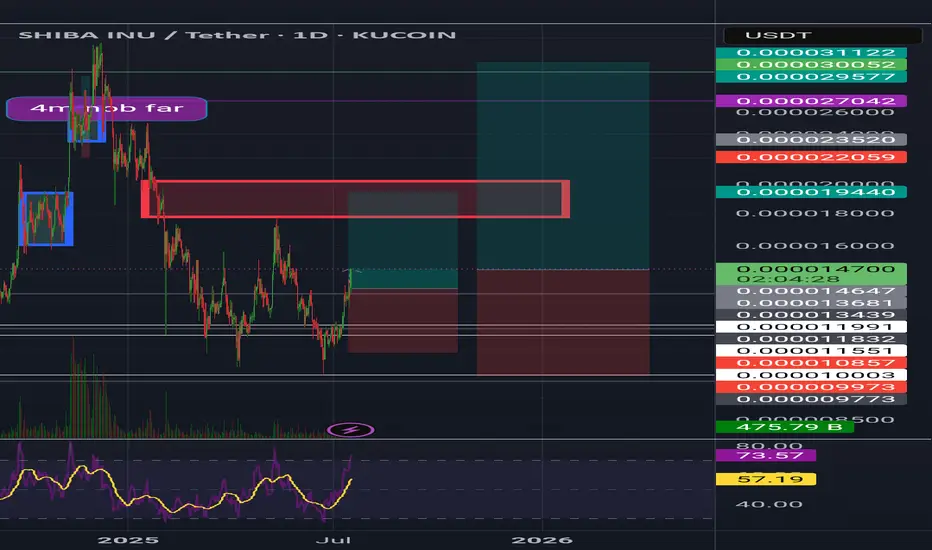
SHIBUSDT | Explosive Breakout from Long-Term Downtrend!📊 Overview:
After months of being trapped in a major downtrend, SHIBA INU (SHIBUSDT) has finally broken out of a multi-month descending trendline that has been capping price action since late 2024. But this isn’t just a minor breakout — this could mark a macro trend reversal, with bullish momentum building up fast.
---
📐 Technical Breakdown (Daily Chart – KuCoin):
🟡 Chart Pattern:
A clear Falling Wedge pattern has been forming since December 2024.
The breakout occurred mid-July 2025 with strong price action and early confirmation from volume.
Falling wedge is typically a bullish reversal pattern — and this breakout confirms that narrative.
🟨 Breakout Zone:
Price decisively broke above the descending trendline and is now consolidating just above it.
A successful retest of the breakout level strengthens the bullish case.
🟦 Key Fibonacci Support – “Golden Pocket”:
The zone between 0.000013011 (Fib 0.5) and 0.000012314 (Fib 0.618) is now acting as strong support.
Known as the “Golden Pocket”, this zone is often where high-probability reversals occur.
---
🚀 Bullish Scenario (High Probability):
As long as price stays above the Fibonacci golden pocket, SHIB is well-positioned for a continued rally. Key upside targets include:
1. 📍 Target 1: 0.000016824 → Previous key resistance
2. 📍 Target 2: 0.000022000 → February supply zone
3. 📍 Target 3: 0.000029000 → Major historical resistance
4. 🏁 Target 4 (Full Extension): 0.000033419 → Potential top of the breakout range
If momentum and market sentiment align, SHIB may be entering a new bullish cycle.
---
🔻 Bearish Scenario (Low Probability, but Manage Risk):
If price fails to hold above the golden pocket:
🔽 Support 1: 0.000011500 → Previous consolidation base
🔽 Support 2: 0.000010050 → Historical demand zone
A breakdown below 0.000010050 would invalidate the bullish structure and shift SHIB back into a prolonged accumulation phase.
---
🔍 Conclusion & Market Sentiment:
✅ The trend has flipped! This is one of the most anticipated breakouts for SHIB holders. As long as the structure holds above the golden pocket zone, the bullish outlook remains very strong.
⚠️ However, beware of potential fakeouts if volume drops or Bitcoin triggers broad market weakness.
---
📢 Trading Setup (Not Financial Advice):
For Bulls: Look for entries around 0.00001350–0.00001300
Stop-loss: Below 0.00001220
Take-profits: 0.0000168 → 0.000022 → 0.000029
For Bears: Wait for breakdown below 0.00001200 to consider short positions
---
🧠 Final Notes:
> SHIB remains a high-volatility microcap token. It's a prime pick for swing traders and momentum hunters — but risk management is key. Keep an eye on BTC for confirmation or invalidation.
#SHIBUSDT #SHIBA #SHIBBreakout #AltcoinSeason #BullishSetup #GoldenPocket #FallingWedge #CryptoSignals #TechnicalAnalysis #BreakoutPlay
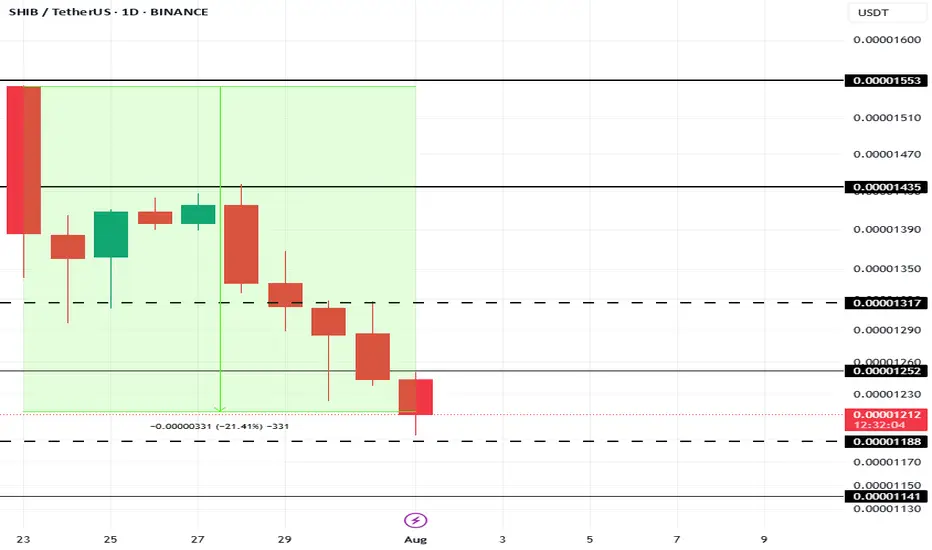
This Is The Cause Of Shiba Inu Price’s 21% Fall In 10 DaysAt present, BINANCE:SHIBUSDT price is sitting at $0.00001210, down 21% over the last 10 days . The drop in Shiba Inu's price can be traced to a sharp decline in the number of new addresses interacting with the token.
In the last 10 days, the number of new addresses has decreased by nearly 40% . This sudden exit of new investors indicates waning confidence in BINANCE:SHIBUSDT price potential, particularly after an extended rally earlier in the year.
If this trend continues, BINANCE:SHIBUSDT could lose the critical support level of $0.00001188, pushing the price down to $0.00001141 or potentially lower. However, if SHIB manages to hold onto its $0.00001188 support level, there is a possibility of recovery.
A bounce from this level could push BINANCE:SHIBUSDT price up to $0.00001317 . Securing this level as support would create a bullish scenario, invalidating the bearish thesis and offering hope for further price growth in the near future.
Shiba Inu Whales Amass 4.66 Trillion SHIB As Price Falls 12%BINANCE:SHIBUSDT price is currently trading at $0.00001353, down 11.5% over the past 24 hours . The altcoin is holding above the support level of $0.00001368.
The large holders' netflow for BINANCE:SHIBUSDT has recently spiked, reaching a two-month high. In the last 24 hours, 4.66 trillion SHIB were accumulated by addresses holding at least 0.1% of the circulating supply. These whales, who have collectively invested $63.7 million , are betting on a price rebound.
A successful bounce off $0.00001317 would likely pave the way for further price appreciation, potentially pushing BINANCE:SHIBUSDT to $0.00001553 . Securing this level as support could mark a recovery of today’s losses and initiate a new uptrend, provided the broader market conditions remain favorable.
On the other hand, if BINANCE:SHIBUSDT falls below the support of $0.00001317 due to profit-taking, the meme coin could slip to $0.00001188 . This would invalidate the bullish thesis and further reduce investor confidence. The next few days will be crucial in determining if SHIB can maintain its current support levels .

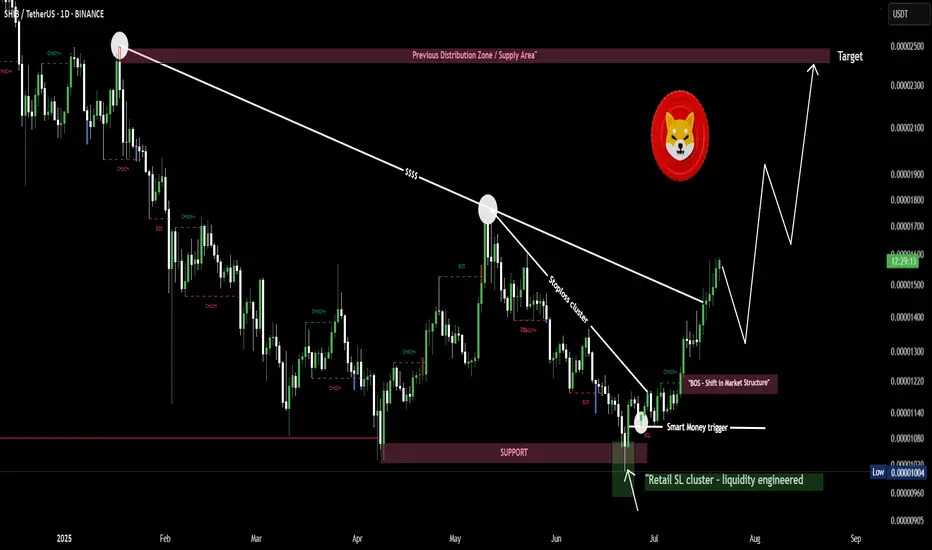
$SHIB/USDT Grabbed liquidity below key support and reversed hardSHIB just gave you a free masterclass in liquidity.
Here’s exactly what happened 👇
2/
Retail panic sold as price broke support.
That break? Engineered.
Liquidity was swept, and price instantly reversed — leaving late sellers wrecked.
3/
Smart money doesn’t chase.
They trap you first, then move the market in their direction.
SHIB is now showing momentum with clean market structure.
Next target: $0.000025🚀🚀
SHIB grabbed liquidity below key support and reversed hard
$SHIB Ready to Move?CRYPTOCAP:SHIB has printed confirmed weekly bullish divergence in RSI and is now attempting to overcome the weekly 200EMA resistance.
A High Volume Node lies just above but a close above this will signal a bullish trend ready to move the initial target of the weekly pivot point followed by the 0.0003579 High Volume Node.
Price completed its retracement to the 'alt-coin' golden pocket 0.786 Fibonacci retracement.
Bearish divergence is currently growing on the weekly RSI but will be diverted with a thrust high!
Is it MEME season? CRYPTOCAP:DOGE also looks ready to go!
Safe trading

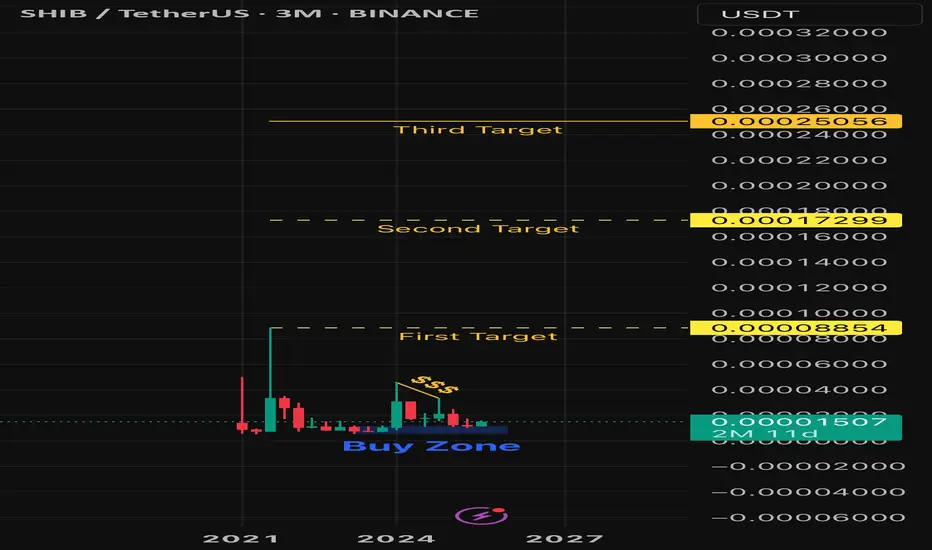
Shib’ I Knew It (targets)Shiba Inu is on its way to its previous all time high and beyond. Will price reach any of my target points this bull run? Who knows? What I do know or at least think I know, is that Shiba Inu is at a discount. Stay tuned!
SHIBUSDT 1D#SHIB has broken above the descending channel and the SMA100 on the daily timeframe. It is now facing the daily SMA200, and it seems likely that we may see a minor correction toward the support level around $0.00001356. In case of a successful retest, the targets are:
🎯 $0.00001635
🎯 $0.00001891
🎯 $0.00002157
🎯 $0.00002423
⚠️ Always use a tight stop-loss and apply proper risk management.

Can Shiba Inu rally 20 percent to hit 0.000015?Hello✌
All previous targets were nailed ✅! Now, let’s dive into a full analysis of the upcoming price potential for Shiba Inu📈.
BINANCE:SHIBUSDT has decisively broken above its descending channel and key daily resistance, supported by fresh, solid volume 📈. This breakout signals strong momentum, with a projected upside of at least 20% targeting 0.000015 🚀.
✨ Need a little love!
We pour love into every post your support keeps us inspired! 💛 Don’t be shy, we’d love to hear from you on comments. Big thanks , Mad Whale 🐋

SHIBUSDT first target is +200% after years of sleepBINANCE:SHIBUSDT is not dead or sleep or it wont be any more and i think in this market soon it can see more gain and this +40% until now is just start and at least our first target which is +200% can hit soon like green arrow.
DISCLAIMER: ((trade based on your own decision))
<<press like👍 if you enjoy💚
SHIBUSDT🕯 The key resistance level, identified as the best resistance for a break and pump, stands at 0.0000135, with a potential price increase to 0.00001567 if breached, serving as the next target (Pullback level). On the support side, the main level is observed at 0.0000115, and should the price fall below this, it may decline further to the lower Major Level of 0.0000100.
🔽 Resistances:
Main resistance level: 0.0000135 (potential break for pump)
Next target (Pullback level): 0.00001567
🔼 Supports:
Main support level: 0.0000115
Lower level (Major Level): 0.0000100
⚠️Contorl Risk management for trades.

DON'T FORGET SHIB IT WILL FLY SOONI've been in this trade for about 5 Months, but patients always pay off no matter if it's 1-2 years it will pay off in the long run thanks you GehavianGoals for holding I'm just thanking myself in this message
Shiba inuShib usdt Daily analysis
Time frame daily
First target = 0 00001944$
Risk rewards ratio =2 👈👌
Second target = 0.00003
Risk rewards ratio >3.5 👈 👌
The red box that you can see on the screen is very important resistance area.
If Shiba breaks it strongly, second target will be reach
SHIB: Keep an eye on this level! Trading Setup
If you’re considering trading SHIB, here’s a quick setup that may help you.
The idea is: Buy when the price breaks above $0.000014 and take profits at the levels shown in the chart.
Targets:
1. $0.0000153
2. $0.0000183
3. $0.000021
4. $0.0000235
-------------------------------------------
About our trades:
Our success rate is notably high, with 10 out of 11 posted trade setups achieving at least their first target upon a breakout price breach (The most on TW!). Our TradingView page serves as a testament to this claim, and we invite you to verify it!
