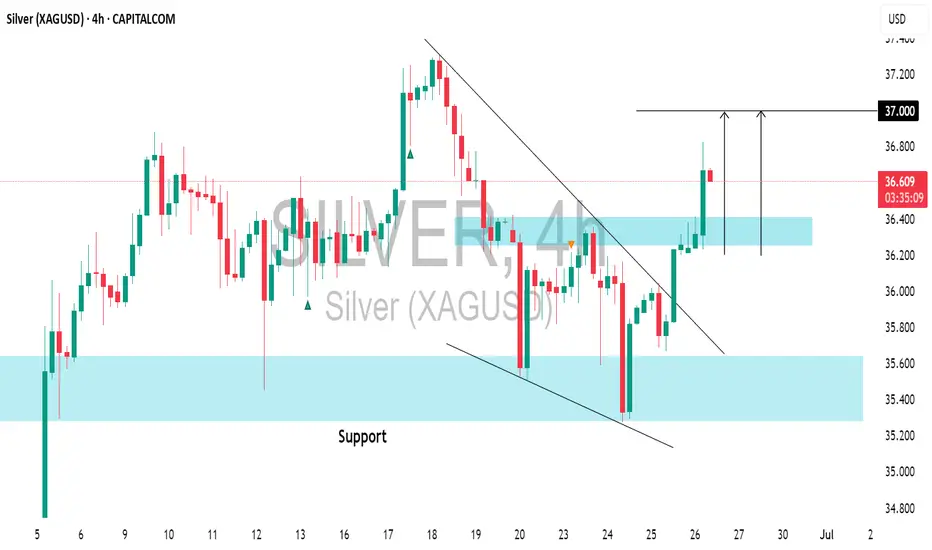
SILVER (XAGUSD): Waiting For BreakoutIt appears that ⚠️SILVER is gearing up for a bullish trend.
Analyzing the 4H time frame, I spotted a falling wedge pattern and a confirmed breakout above its upper boundary.
The final hurdle for buyers is the 36.11 - 36.17 neckline of a cup and handle pattern.
If the bulls manage to break and

SILVER (XAGUSD): Intraday Bullish Confirmation?!📈SILVER appears to be on a bullish trend following a bounce off crucial daily/intraday horizontal support.
The price broke through a resistance line of a descending channel and created a local Change of Character (CHoCH).
There is a strong likelihood that the price will keep rising, with a targe
KOG - SILVERSILVER
As with gold and oil, looking at this expecting a gap on open and potential for a move driven by the news. If we do spike down, the red box is the level to watch with the red box levels above as potential target levels on the breaks.
Please do support us by hitting the like button, leavi

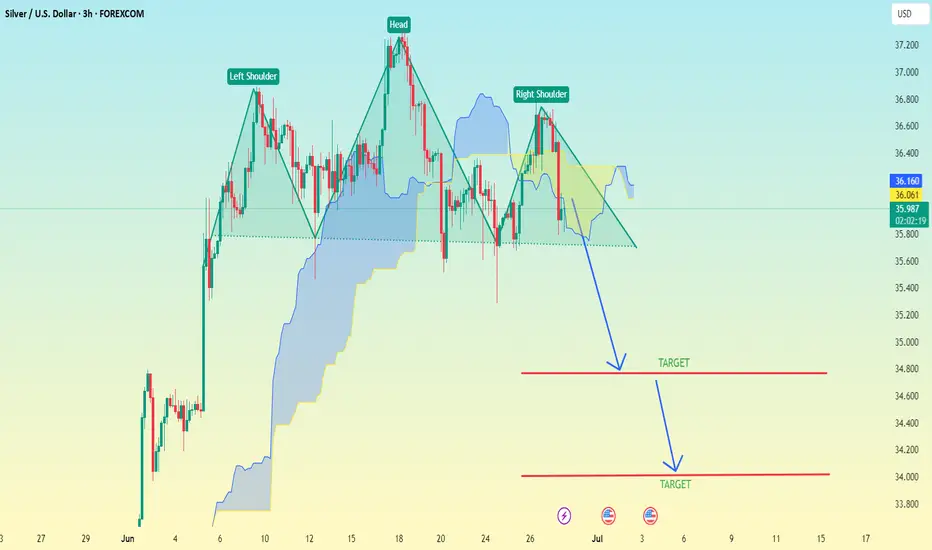
(XAG/USD – Silver vs USD–3h timeframe) Head and Shoulder Pattern(XAG/USD – Silver vs USD – 3h timeframe), a Head and Shoulders pattern is clearly marked, which is a bearish reversal signal.
Key Details:
Pattern: Head and Shoulders
Neckline: Approximately at the 35.90–36.00 level
Breakout Direction: Down
Measured Move Target Method: To estimate the target, s
Silver bearish IdeaHi all! This is my first post and I'm pretty new to this. But I think the best way to learn is to just go for it. So this idea might be super stupid, but at least I'm trying :)
Happy trades!

$18 retest.Silver historically always crushes the bulls when they are most hopeful for a parabolic breakout.
Even if we are at the start of a super bull cycle in silver, the bull market MUST have massive retracements to achieve insane highs. The higher and faster a bull market goes up without complete washou

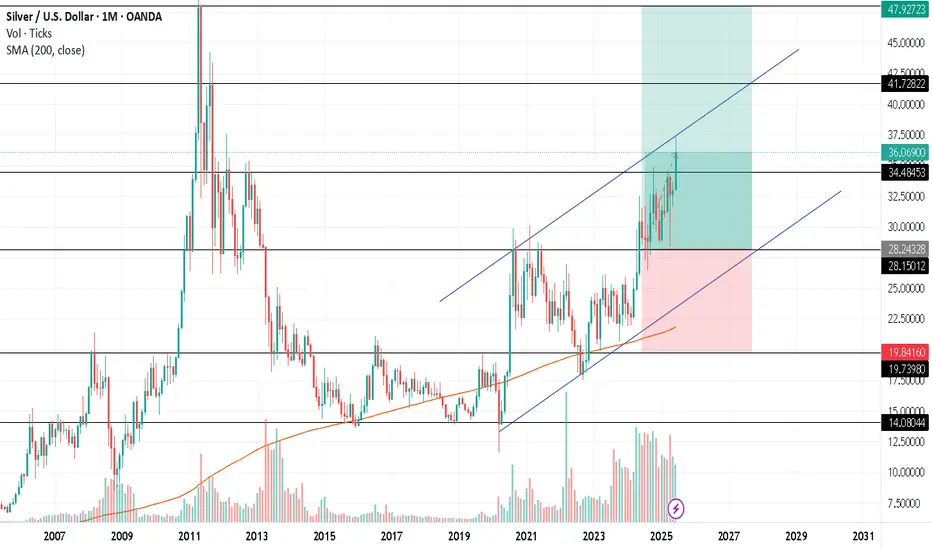
Silver could also outperform the stock market by 52%?Silver would need to rally 33% from current levels to retest its potential historical breakout line around $48.
If that happens in sync, silver could also outperform the stock market by 52% — reaching its own breakout level on the silver vs. stocks ratio chart.

This is the thing about silver & recessions...This is the thing about silver & recessions...
You can STILL have price rocket upwards heading into it.

Silver Looking For A Support Of wave 4 at 36.37Silver retested the lows of the week and even broke slightly below the spike from June 12, where the market previously found support at 35.46. We highlighted that as a key area for potential stabilization, especially since there were likely a lot of stops, just below it. So it's no surprise that the

See all ideas
Displays a symbol's price movements over previous years to identify recurring trends.